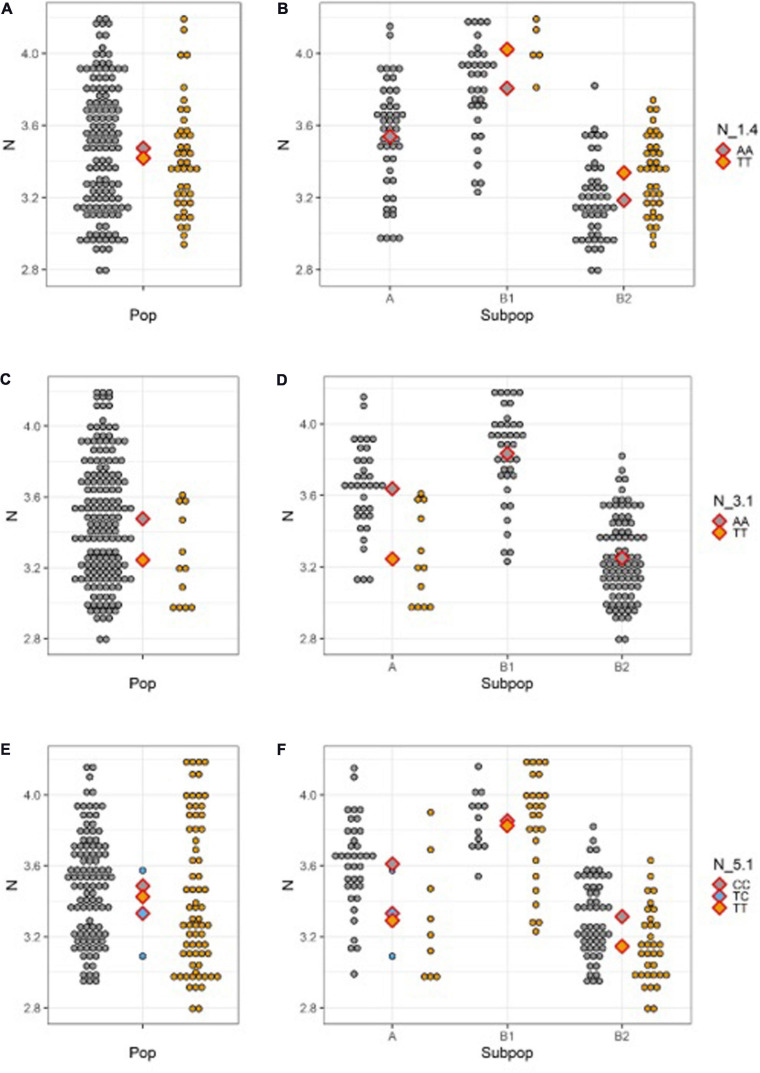
FIGURE 4.
N seed content distribution for different allele classes across the whole population (left) and within subpopulations (right; A Mesoamerican; B1 Andean; B2 Andean) for: (A,B) N_1.4; (C,D) N_3.1; (E,F) N_5.1. Diamonds designate population/subpopulation means for reference allele homozygotes (gray), SNP homozygotes (yellow), and heterozygotes (blue).

