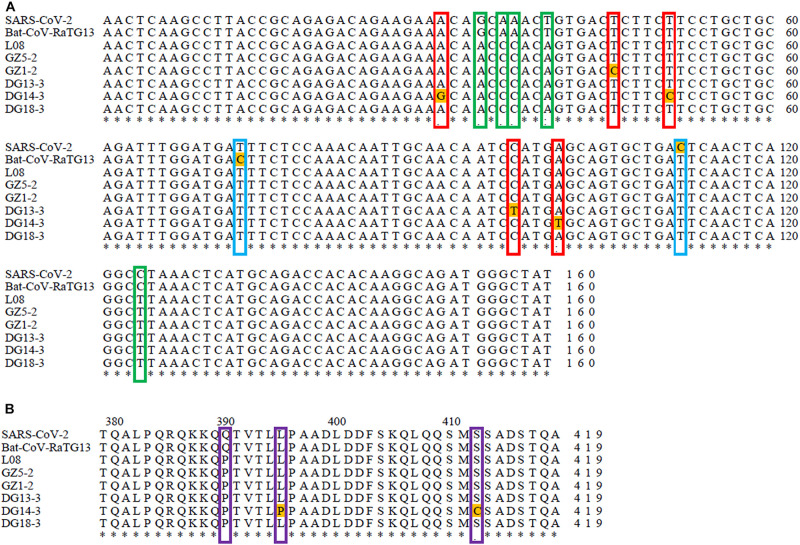
FIGURE 2.
Sequence comparison between SARS-CoV-2, Bat-CoV-RaTG13, and pangolin-CoVs based on their N gene sequence: (A) Sequence comparison between SARS-CoV-2, Bat-CoV-RaTG13, and pangolin-CoVs based on their N gene nucleotide sequence. The red frame indicates nucleotide variation sites among pangolins. The green frame indicates nucleotide variation sites between pangolins and SARS-CoV-2 or Bat-RaTG13. The blue frame indicates nucleotide variation sites between SARS-CoV-2 and Bat-RaTG13. (B) Sequence comparison between SARS-CoV-2, Bat-CoV-RaTG13, and pangolin-CoVs based on their N gene amino acid sequence. The purple frame indicates amino acid variation sites between pangolins and SARS-CoV-2 or Bat-RaTG13. The asterisk indicates that all nucleotide and amino acid sites are exactly the same in all compared sequences.

