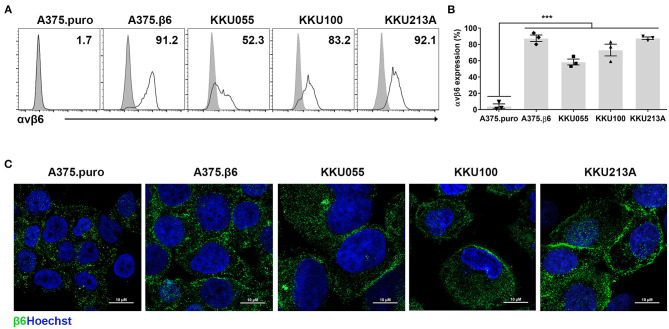
Figure 2.
Expression of integrin αvβ6 on cholangiocarcinoma (CCA) cell lines. (A) Integrin αvβ6 was stained with anti-integrin αvβ6 mAb in the indicated CCA cell lines and analyzed by flow cytometry. A representative result of flow cytometry analysis demonstrates CCA cell lines stained with isotype-control antibody (gray peaks), and CCA cell lines stained with anti-integrin αvβ6 mAb (white peaks). (B) A quantification bar-graph summarizes the data from 3 independent experiments (***p < 0.001). The data with error bar represent mean ± standard error of mean (SEM). Differences between the group of β6-negative A375.puro cells and those of cell lines with positive expression of integrin αvβ6 were analyzed by one-way analysis of variance (ANOVA). (C) Immunofluorescence images of CCA cell lines show membranous and granular expression of integrin β6 stained with anti-β6 polyclonal antibody (green) and nuclei staining (Hoechst 33342; blue), and A375.β6 was used as a positive control. Scale bars represent 10 μm.

