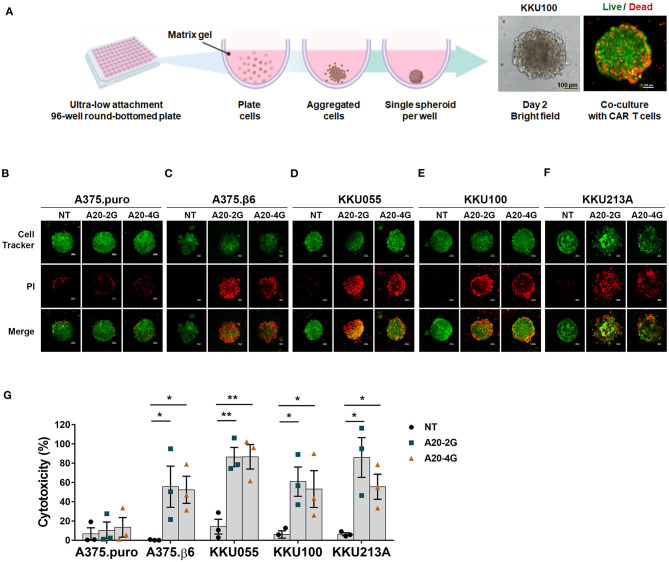
Figure 5.
A20-2G and A20-4G CAR T cells mediated killing of CCA tumor spheroids. (A) Schematic diagram of spheroid forming in a round-bottomed plate. Representative images on the right show bright filed of a spheroid formed by 2 × 10³ cells for 48 h and a fluorescence image after co-culturing CAR T cells with the spheroid. (B–F) Representative images showing cytolytic activities of A20-2G or A20-4G CAR T cells compared to NT cells at an effector to target (E:T) ratio of 5:1 on the spheroids of A375.puro, A375.β6, and CCA (KKU055, KKU100, KKU213A) at 72 h of co-culturing. Dead of green fluorescence-labeled cells were visualized by PI uptake (Red). (G) Histogram shows cytotoxic activities of NT cells, A20-2G CAR T cells, and A20-4G CAR T cells on tumor cells determined by PI incorporation of dead cells within spheroids. Note that lower level of the percentage of cytotoxicity of A20-4G CAR T cells for KKU213A resulted from more CCA cell lysis. The bar graphs represent mean ± standard error of the mean (SEM) (n = 3; *p < 0.05, **p < 0.01).

