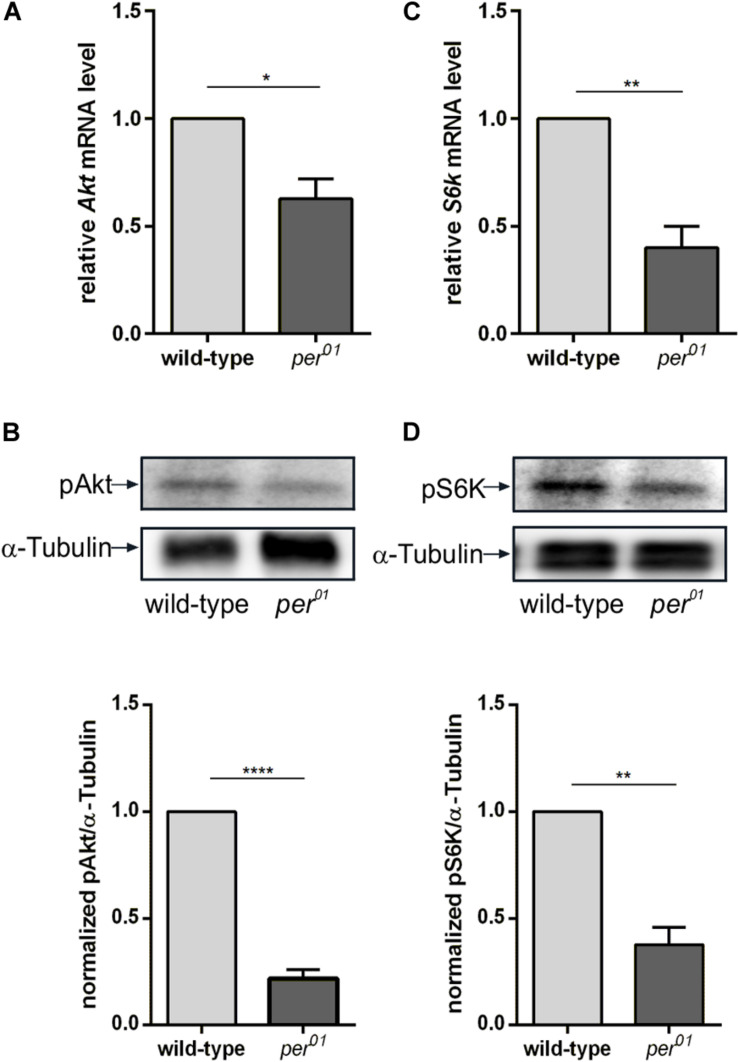
FIGURE 6.
Clock dependent transcription and phosphorylation of Akt and S6K. (A,C) RT-qPCR analysis of Akt (A) and S6k (C) transcription in 3rd instar larval brains from wild type and per01. Each bar represents the mean ± standard error of the mean (SEM) obtained from three biological replicates, each repeated in triplicates. As an internal control, rp49 was used (∗p < 0.01 and ∗∗p < 0.001, respectively). (B,D) Representative Western blots from 3rd instar larval brain lysates probed for pAkt (B) and pS6K (D). α-Tubulin was used as a loading control. Graphs represent measurements of pAkt and pS6K phosphorylation level out of three biological replicates normalized to α-Tubulin (mean ± SEM) (****p < 0.00001 and ∗∗p < 0.001).

