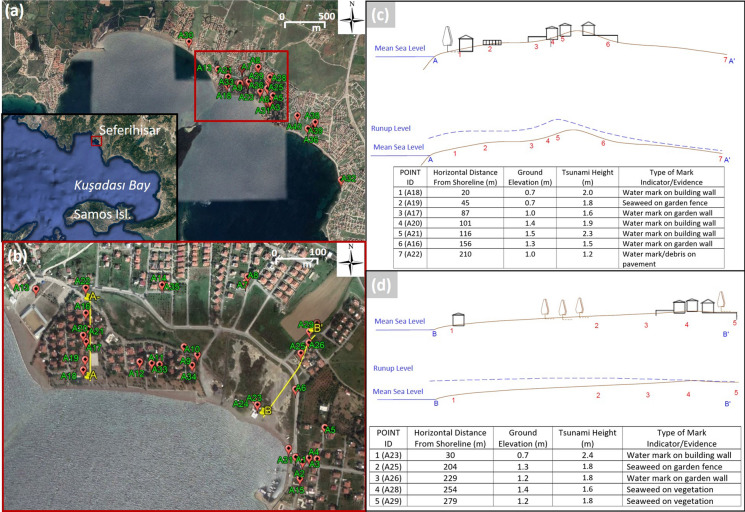
Fig. 13.
a General and b closer view of the surveyed locations in Akarca. The red rectangle shows the central bay of Akarca, where the tsunami impact was highly localized. c, d Cross profiles of measured tsunami inundation heights in Akarca at A–A′ and B–B′, respectively (image is
taken from Google Earth)

