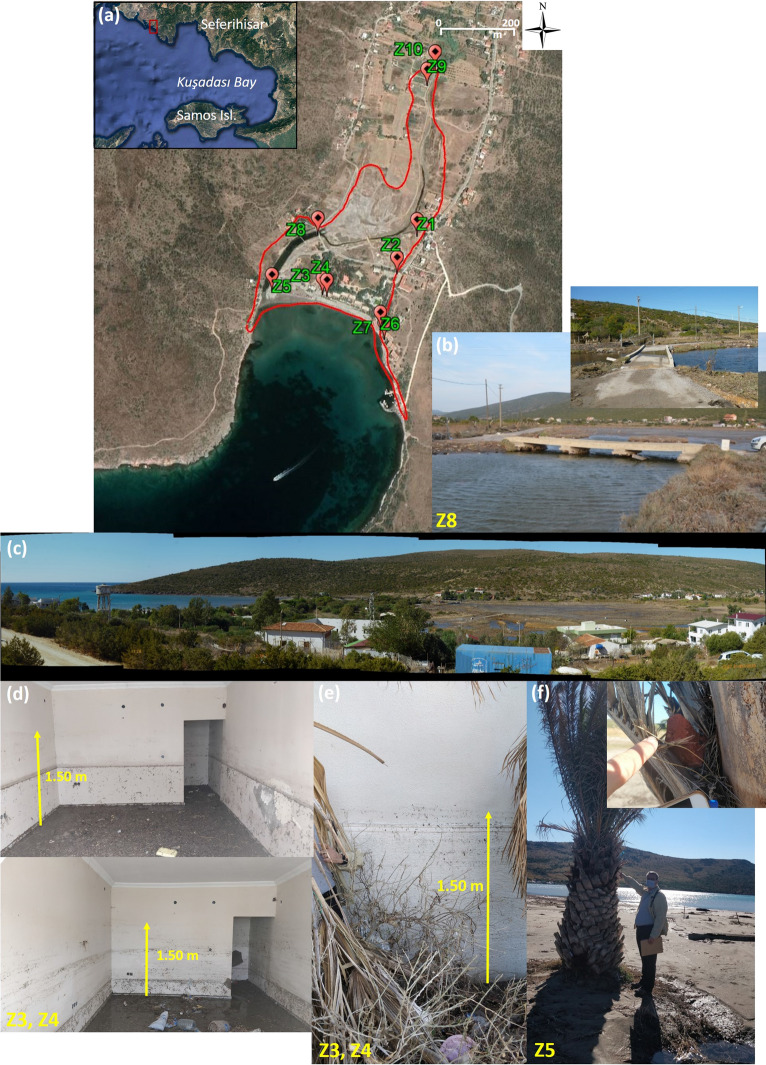
Fig. 4.
a Map showing the surveyed locations and the tsunami inundation zone (red line) in Zeytineli (image is
taken from Google Earth). The corresponding survey location IDs are indicated at the lower left corner of each figure. b Damaged bridge on Zeytineli Azmak due to tsunami. c Panoramic view of tsunami inundation in Zeytineli. Debris accumulated d inside and at e outer wall of a house (flow depth 1.5 m). f Wave traces on palm tree near the coastline (flow depth 1.9 m)

