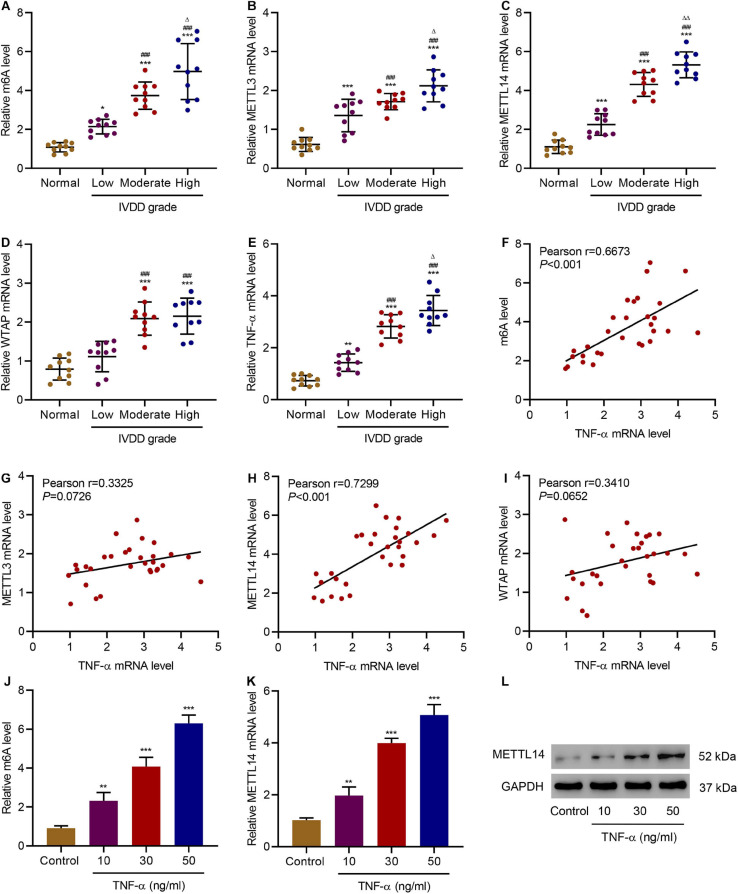
FIGURE 1.
Correlation between TNF-α and m6A modification in IVDD patients. (A) The m6A level and expression of (B) METTL3, (C) METTL14, (D) WTAP, and (E) TNF-α in normal controls and IVDD patients. (F–I) Pearson correlation scatter plots in IVDD patients (n = 30). (J) The m6A level and (K,L) expression of METTL14 in HNPCs treated with different doses of TNF-α. *P < 0.05, **P < 0.01, ***P < 0.001 compared with normal control; ###P < 0.001 compared with low grade; Δ P < 0.05, ΔΔ P < 0.01 compared with moderate grade.

