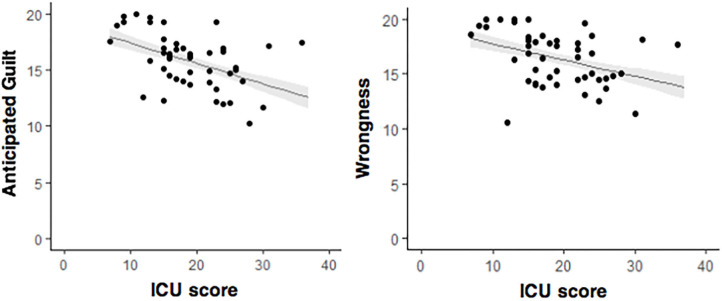
Figure 2.
Scatter plots depicting the associations between CU traits (X axes) and anticipated guilt (graph on the left) and wrongness (graph on the right) ratings to moral transgressions. The black lines at each graph illustrate linear effects of CU traits on guilt and wrongness ratings, respectively. The shaded area (in gray) represents the 95% confidence interval of the prediction.

