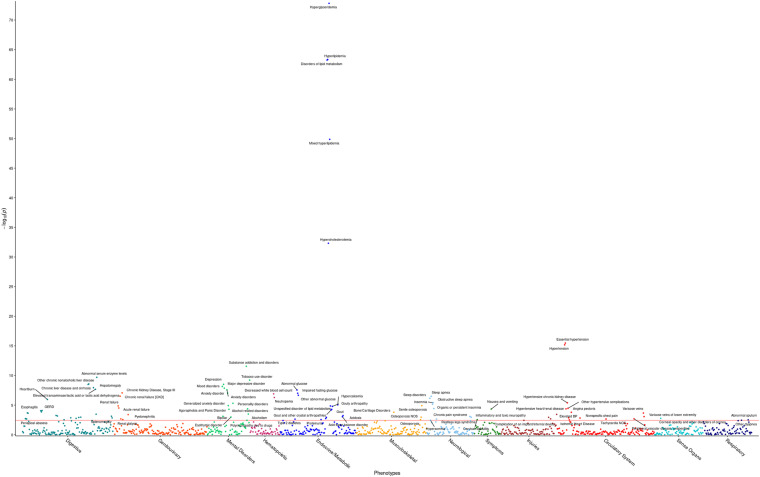
FIGURE 1.
Phenome-wide analysis in the HNPT_EU between triglyceride levels and EHR diagnoses. Each point represents the p-value of an individual association between triglyceride levels and incidence of one of 1,372 phenotype groups, with covariates age, sex, DM2, and PC1–PC4. The x-axis shows different phenotypic conditions, grouped into 11 groups. The y-axis presents the -log10 transform of the p-value of each association. The significance level α = 3.8 × 10– 3 is shown by the horizontal red line. Comprehensive results can be found in Supplementary Table 2.

