
Fig. 3. Accelerated diet-induced NASH in Agxt1−/− mice.
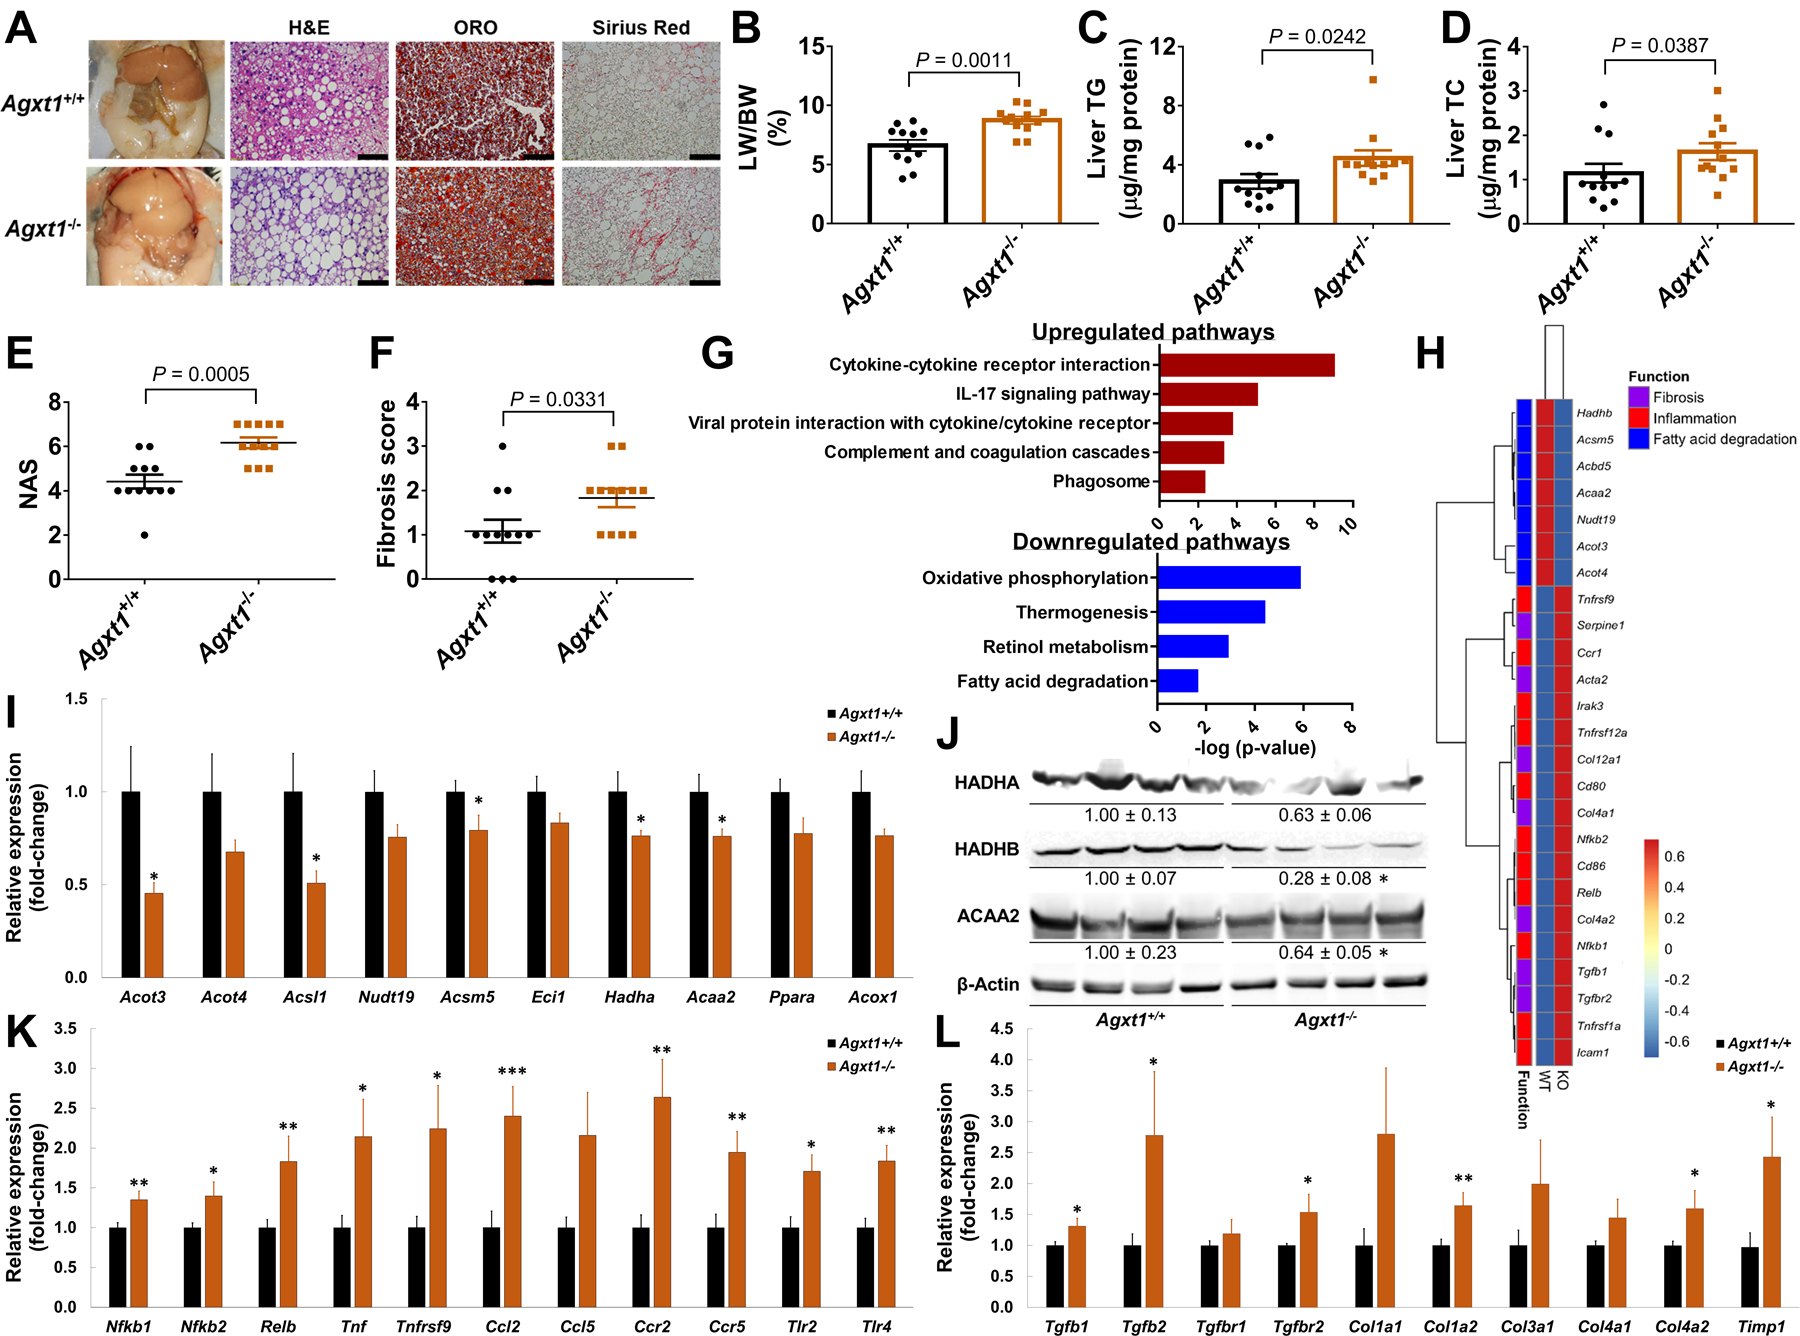
Agxt1+/+ and Agxt1−/− mice were fed NASH-diet for 12 weeks (n=12): (A) Gross appearance of the peritoneal cavities and liver histology (Scale bar: H&E and Sirius Red 50μm, ORO 100μm), (B) liver weight/body weight ratio (LW/BW %), (C) liver TG, (D) liver TC, (E) NAS and (F) fibrosis score. (G) Pathway analysis following RNA-sequencing of livers from Agxt1+/+ and Agxt1−/− mice (n=4). Pathways enriched in the up- or down-regulated DEG are plotted in red or blue, respectively. (H) Heatmap of NASH-related DEG. (I) FAO-related DEG confirmed by qPCR (n=10) and (J) Western blot (n=4). (K) Inflammation- and (L) fibrosis-related DEG confirmed by qPCR (n=10). *P<0.05, **P<0.01, ***P<0.001 vs. Agxt1+/+. Data are means ± SEM. Statistical differences were compared using Student’s t test or Mann-Whitney U test. The significance of the enriched pathways was determined by right-tailed Fisher’s exact test followed by Benjamini-Hochberg multiple testing adjustment.