
Fig. 5. The effects of DT-109 on the gut microbiome on NASH-diet and CD.
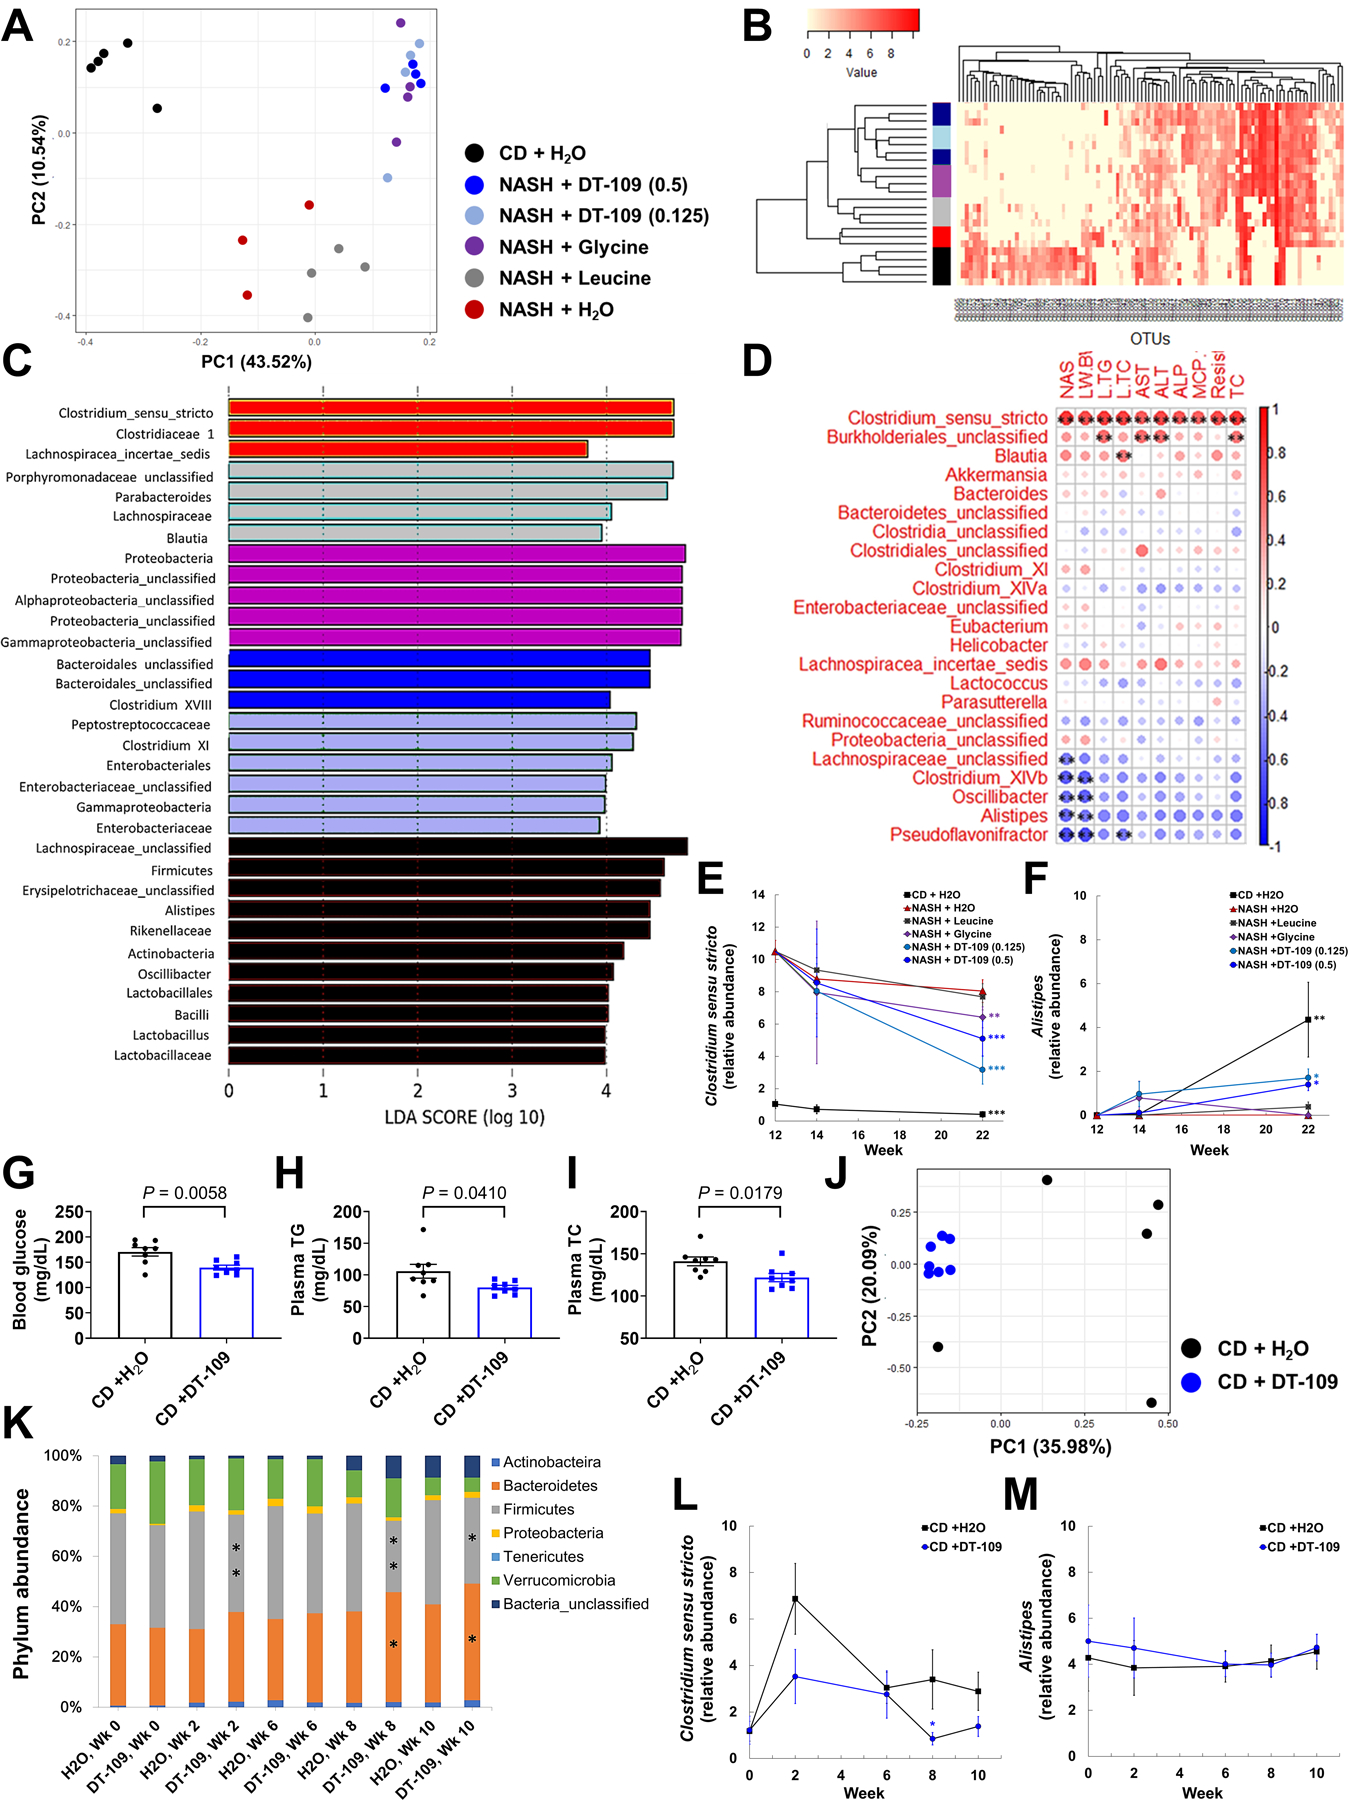
Fecal samples were obtained after 10 weeks of treatment on NASH-diet or CD (Fig. 4A). (A) PCA, (B) hierarchical clustering of OTUs in each group (sidebar colors as in A), (C) LDA of overrepresented bacterial taxa in each group, (D) correlations between altered genera and NAFLD-related parameters. Spearman’s correlation coefficients are represented by color ranging from blue (−1) to red (+1), **P<0.01. Relative abundance of (E) Clostridium sensu stricto and (F) Alistipes in fecal samples from each group before (week 12), after 2 and 10 weeks of treatments. (n=3–5 cages) **P<0.01, ***P<0.001 vs. NASH before treatments. C57BL/6J mice were fed CD and treated with 0.5 mg/g/day DT-109 for 10 weeks. (G) Endpoint non-fasting blood glucose, (H) plasma TG and (I) TC (n=8 mice). Fecal samples were obtained at baseline and after 2, 6, 8 and 10 weeks of DT-109 treatment: (J) PCA at endpoint, (K) phylum-level comparison, (L) Clostridium sensu stricto and (M) Alistipes in fecal samples from each group throughout the study (n=5–7 cages), *P<0.05, **P<0.01 vs. CD +H2O. Data are means ± SEM. Statistical differences were compared using Student’s t test or Mann-Whitney U test or using one-way ANOVA followed by Bonferroni post-hoc test or by Kruskal-Wallis test followed by Dunn’s post-hoc test.