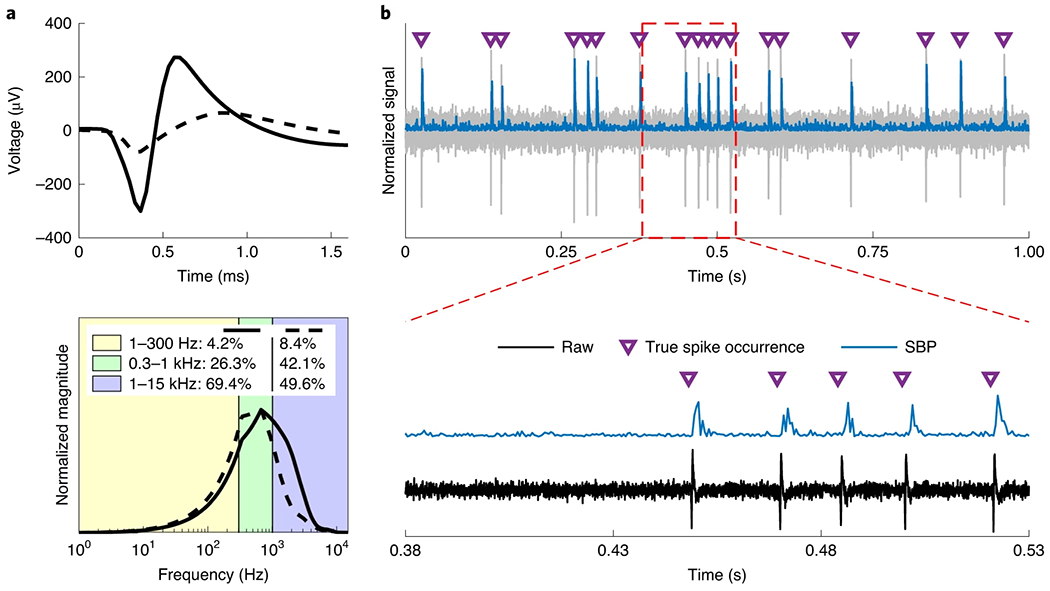
Fig. 1 |. Representation of spikes in the 300–1,000 Hz band.

a, Frequency spectrum of two averaged neural spikes (solid line, narrow/putative inter-neuron; dashed line, wide/putative pyramidal neuron) extracted from intracortical non-human primate recordings. Top: averaged neural spike waveforms. Bottom: interpolated fast Fourier transform of the above waveforms split by relevant frequency bands, normalized to the maximum value for each transform. The numbers in the legend indicate the amount of power belonging to each frequency band, with the solid line represented by the left-most set of percentages. b, Single-unit simulated recording of the solid-line unit in a at an SNR of 10. Top: raw simulated noisy signal (grey) with spike occurrences (purple triangles) and SBP (blue) overlaid. Bottom: a snippet of the top plot with the SBP manually offset vertically to avoid occlusion.
