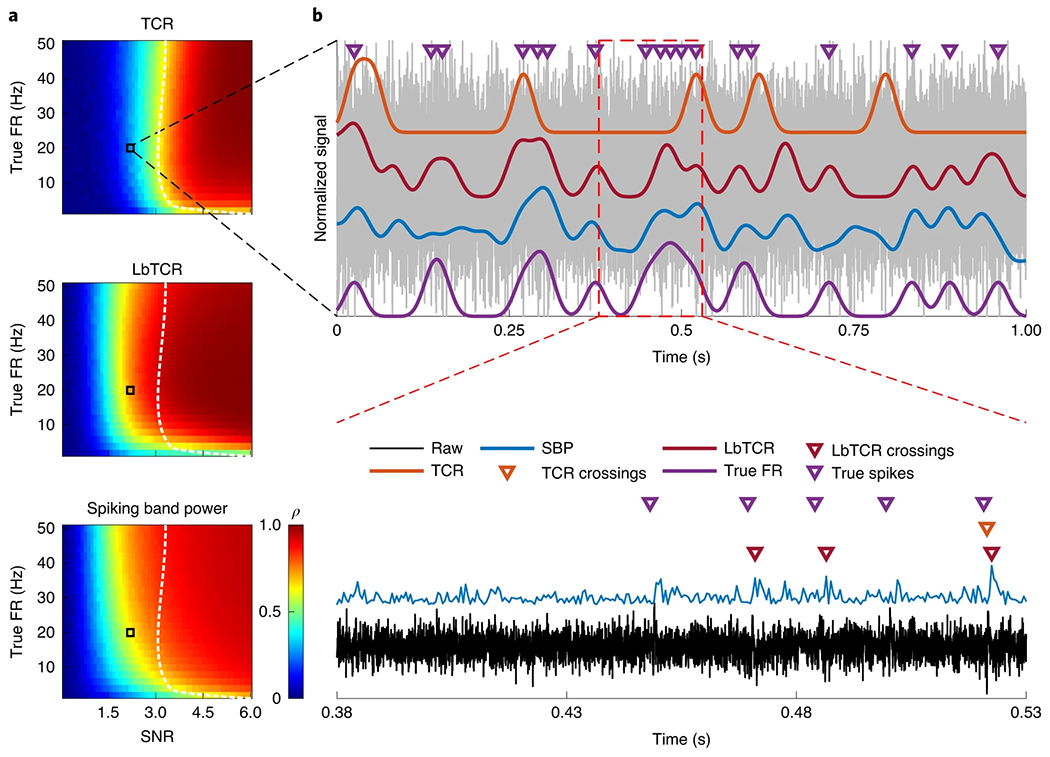
Fig. 2 |. SBP, TCR (optimized threshold set at −3.75 × r.m.s.) and low-bandwidth TCR (optimized threshold set at 2.75 × r.m.s.) prediction of true firing rate.

a, Predictive capability of the three features of various true firing rates from various recording SNRs. The colour bar represents the Pearson’s correlation coefficient (ρ) between the smoothed neural feature and the unit’s smoothed true firing rate. Zero-phase smoothing used a 50 ms Gaussian window. The black boxes indicate the simulated recording conditions in b, and the white dotted lines track the yellow region of the TCR plot to better compare performance. The averages of 100 simulations with random spike timings and noise are shown, with each simulation containing 144,000 samples at 30 kSps and 9,600 samples at 2 kSps. b, The same simulated unit plotted in Fig. 1b but with an SNR of 2.25. Spike occurrences are overlaid as purple triangles along with smoothed TCR (orange), smoothed low-bandwidth TCR (LbTCR; red), SBP (blue) and true firing rate (true FR; purple).
