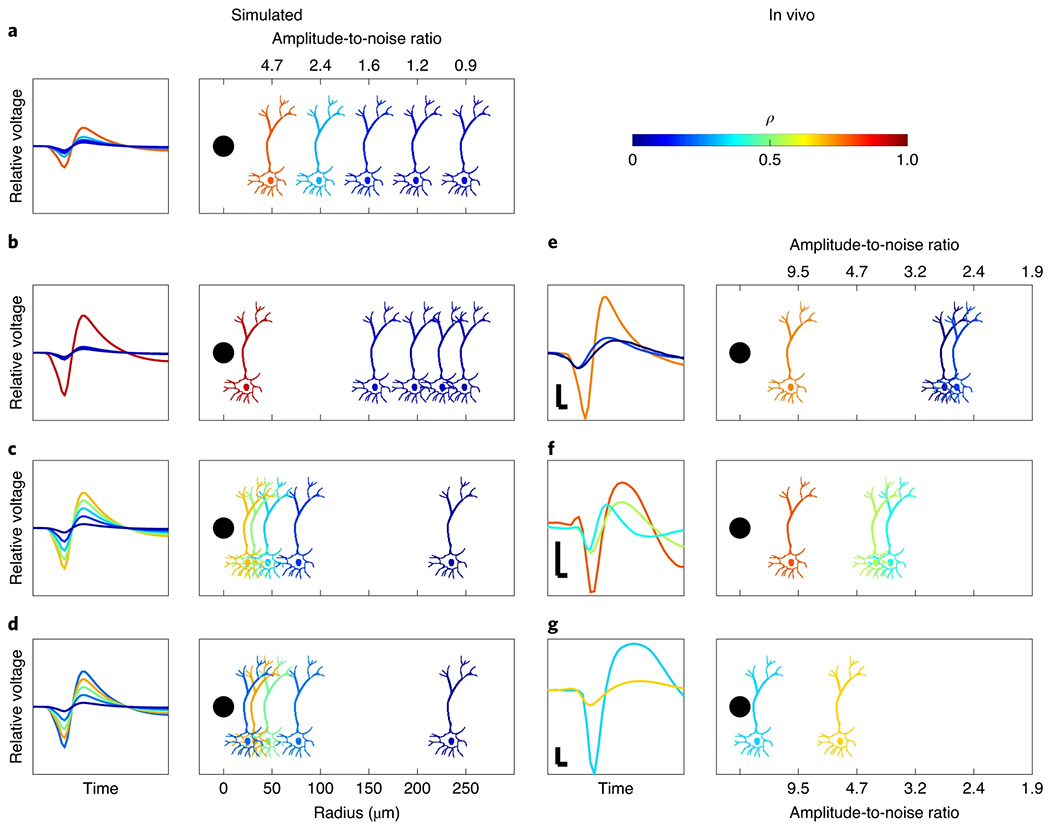
Fig. 3 |. Correlation between the true firing rate of individual units and the field’s SBP.

a–g, Each rectangle represents an arrangement of neurons distributed as shown. The schematic of the neurons and their corresponding spikes to the left are coloured according to their firing rate’s Pearson’s correlation with the recording’s SBP. a–d, Simulated arrangements. e–g, In vivo recording arrangements estimated by amplitude. Simulated neurons all fire at 20 Hz, unless otherwise specified. The averages of 100 simulations with random spike timings and noise are shown, with each simulation containing 144,000 samples at 30 kSps and 9,600 samples at 2 kSps. The in vivo analyses on the right are similar in relative amplitude content to the simulations immediately to the left. Vertical and horizontal scale bars are 100 μV and 0.1 ms, respectively. Firing rates listed below are ordered from left to right as shown. The black dots in the panels represent the electrode. a, Neurons are cumulatively displaced by 50 μm. b, Neurons spaced in a constant volumetric density around the electrode. c, Neurons organized with amplitude to noise ratios of 9, 7, 5, 3 and 1. d, The same as c, but the highest relative amplitude neuron fires at 1 Hz. e, In vivo recording from monkey W with units firing at 25, 34 and 7 Hz. f, In vivo recording from a carbon fibre electrode in rat motor cortex with units firing at 9, 12 and 9 Hz. g, In vivo recording from a carbon fibre electrode in rat motor cortex with the units firing at 0.5 and 15 Hz.
