
Fig. 4 |. Comparison between the decoding performances of SBP and TCR.
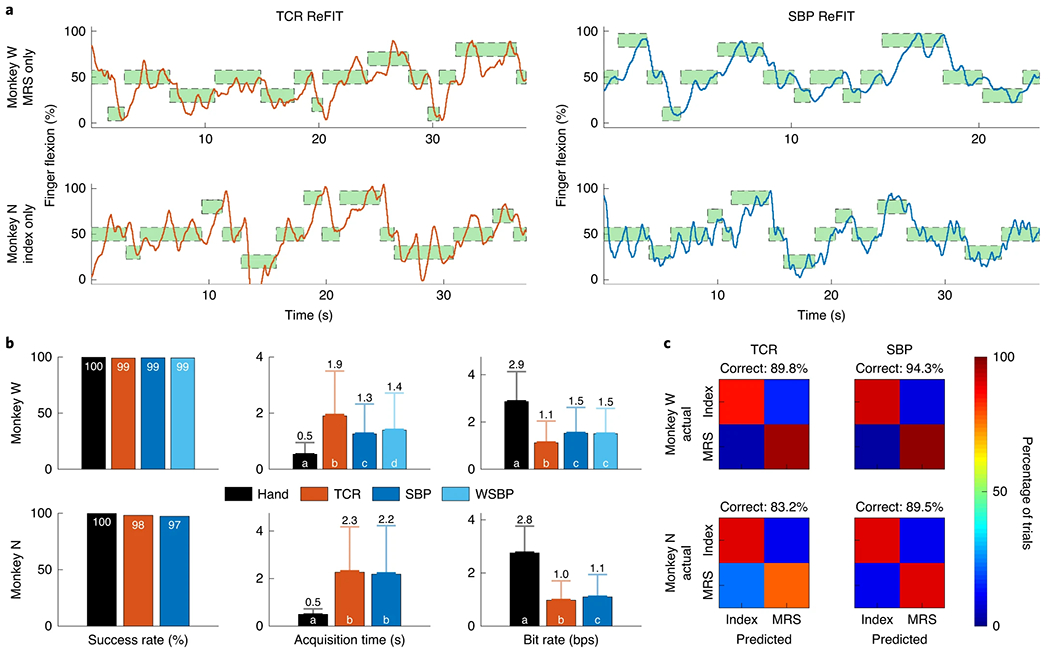
a, Closed-loop decode traces from translating TCR in orange (left) or SBP in blue (right) for 15 targets of each decoder. The top panels are for monkey W and the bottom panels are for monkey N. Targets are green (for successful acquisition) and surrounded by a dashed line. b, Success rate, acquisition time and bit-rate statistics for all methods of closed-loop virtual hand control. Columns represent mean with standard error shown by the darker error bars (very small, so the error bars are difficult to distinguish from the mean bar) and standard deviation shown by the lighter error bars. These statistics resulted from 4,659 hand trials, 1,084 TCR decoder trials, 2,042 SBP decoder trials and 2,428 wideband SBP (WSBP) decoder trials from monkey W and 1,556 hand trials, 1,256 TCR decoder trials, and 1,915 SBP decoder trials from monkey N. Bars in a group labelled with the same letter are statistically similar. For example, in monkey W’s bit-rate statistics, for the case where the virtual hand was controlled directly by physical hand movements, it was exclusively labelled ‘a’ because it was statistically different. TCR control’s bit rate was also statistically different than all others, so it was exclusively labelled ‘b’. However, the bit rates for SBP and WSBP control were statistically similar to each other, so they share label ‘c’. P < 1 × 10⁻³ between SBP and WSBP for monkey W acquisition time and between SBP and TCR for monkey N bit rate. P < 1 × 10⁻¹⁸ otherwise. All statistical tests were single-tailed, two-sample t-tests. The legend represents trials in which the virtual fingers were controlled by the monkey’s physical hand movements or the TCR, SBP or WSBP (300–6,000 Hz pass band) decoders, respectively. c, Support vector machine confusion matrices from classifying finger movements as index or MRS.