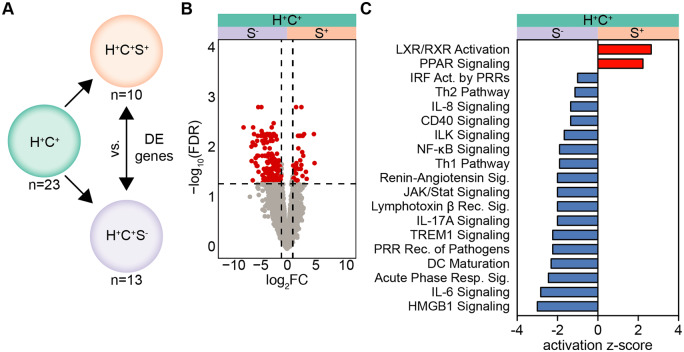
Figure 2.
Anti-inflammatory transcriptome modification in CM of statin-using H+C+ participants. (A) Differentially expressed genes (FDR < 0.05, |log2FC|>1) within H+C+ participants taking statins (S+, n = 10) or not (S−, n = 13) at the time of PBMC visit, determined using edgeR. (B) Hierarchically clustered heatmap of DE genes; heatmap normalized by row z-score. Gene lists in Supplementary material online, Tables S8 and S9. DE gene list with log2FC was used as input into Qiagen IPA core analyses. (C) Predicted regulation of canonical pathways between S+ and S−; red bar indicates activation, blue bar indicates inhibition in H+C+S+. All pathways shown were significantly enriched; significance calculated by right-tailed Fisher’s exact test, P < 0.05.

