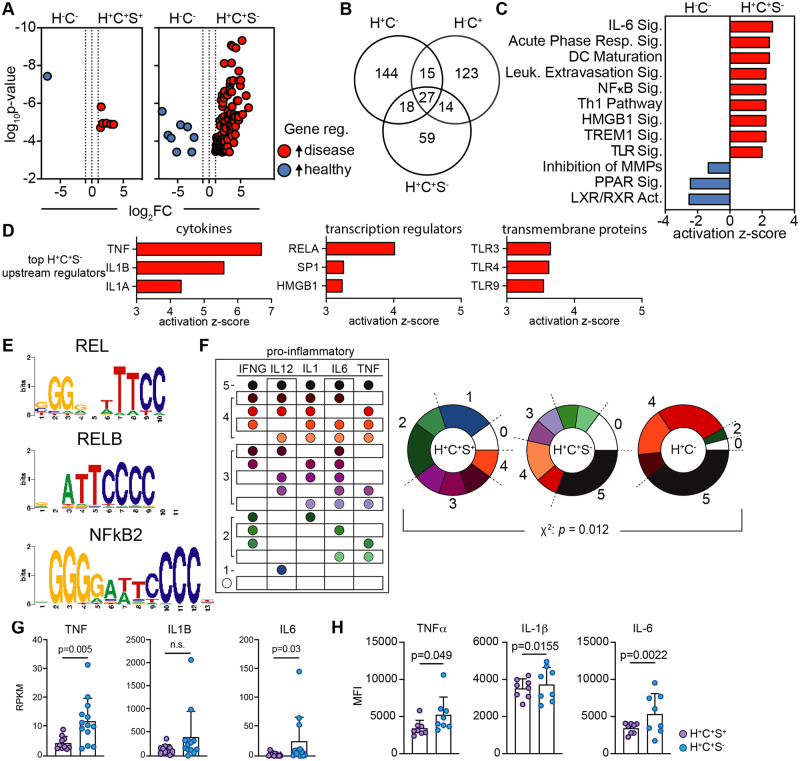
Figure 3.
Statin use associated with reduced pro-inflammatory cytokine and gene expression in H+C+ participants. (A) Differentially expressed genes were determined, by edgeR, for H+C+S+ (n = 10) and H+C+S− (n = 13) participants vs. H−C− (n = 23, Supplementary material online, Tables S11–S14), respectively; significance defined by FDR < 0.05, |log2FC|>1, red genes higher in H+C+, blue higher in H−C−. (B) Venn diagram of highly expressed genes from DE analyses between each disease group vs. H−C−. DE genes and log2FC from H+C+S− vs. H−C− were used for a core pathway analysis in Qiagen IPA. (C) Significantly enriched, activated and inhibited canonical pathways and (D) the predicted top upstream cytokines, transcriptional regulators, and transmembrane receptors influencing gene expression. (E) Up-regulated gene list (H+C+S−) was used as input into PScan to identify significantly enriched common DNA-binding motifs; P < 0.05. RPKM gene expression of top 5 pro-inflammatory cytokines, INFG, IL12 (IL12B), IL1 (IL1B), IL6, and TNF, for each participant within the H+C−, H+C+S−, and H+C+S+ groups compared to the median RPKM expression of the H−C− participants. Participants with higher expression than the median (greater than healthy) were considered positive expressers of the gene. (F) All combinations of gene expression patterns of top 5 inflammatory genes. Fraction of participants overexpressing 0–5 inflammatory genes. The χ2 analysis was used to determine significance in pattern differences. (G) RPKM normalized gene expression for H+C+S− (n = 13) and H+C+S+ (n = 10) participants for inflammatory cytokines TNF, IL1B, and IL6; significance by Mann–Whitney test. Cryopreserved PBMCs were stimulated with LPS for 6 h and CM subsequently analysed by flow cytometry for intracellular cytokine expression (median fluorescence intensity) for (H) TNFα, IL-1β, and IL-6; H+C+S− (n = 8) and H+C+S+ (n = 8), significance determined by unpaired t-test.

