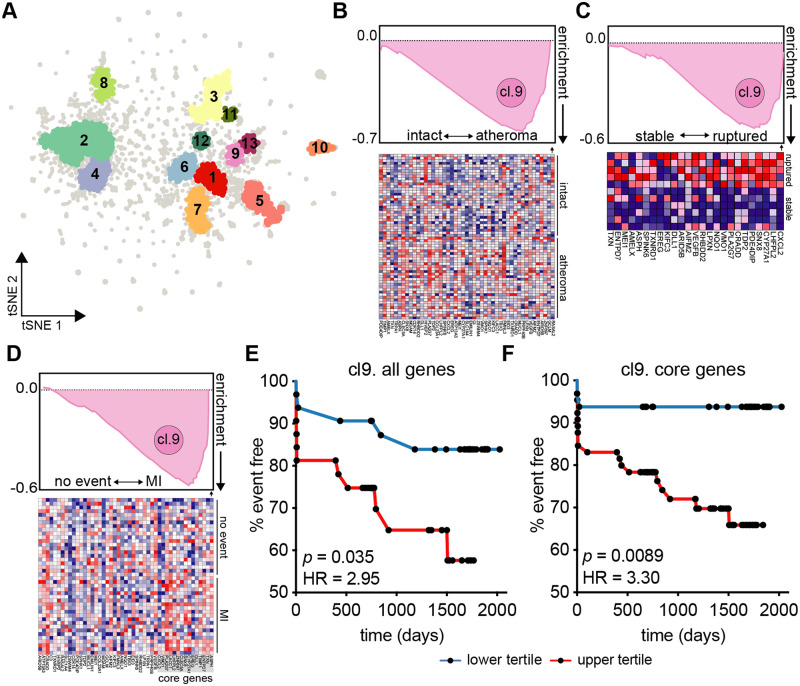
Figure 4.
Higher cardiovascular risk associated with CM gene cluster in H+C+ participants. (A) To identify gene co-expression networks, the entire RPKM gene expression matrix (n = 92) was used as input into PRESTO. The top ∼3300 variable genes segregated into 13 clusters identified using DBScan. (B) Cluster 9 gene list was applied to tissue biopsy transcriptomes of hypertensive patient-matched carotid endarterectomy macroscopically intact tissue vs. atheroma plaque (n = 32, GSE43292); all cluster 9 genes across all patients shown below. (C) Transcriptomes of laser micro-dissection macrophage-rich (CD68+) carotid plaque regions of stable (n = 5) or ruptured (n = 6) plaques (GSE41571) using gene set enrichment analysis (GSEA). Top 25 genes and their expression across patient plaques shown below. (D) GSEA applied to PBMC transcriptomes (n = 97) of the BiKE cohort (GSE21545) and identified core enrichment genes within cluster 9. (E) Patients were divided into top and bottom tertiles based on their PBMC mean expression of all cluster 9 gene [HR = 2.95, 95% CI (1.08–8.04)] or (F) core enrichment genes [15 genes, HR = 3.30, 95% CI (1.35–8.06)] and analysed for gene expression-associated ischaemic event risk. Kaplan Meier curves show time (days) until ischaemic event; significance by log-rank test, hazard ratio (HR) by Mantel–Haenszel analysis.

