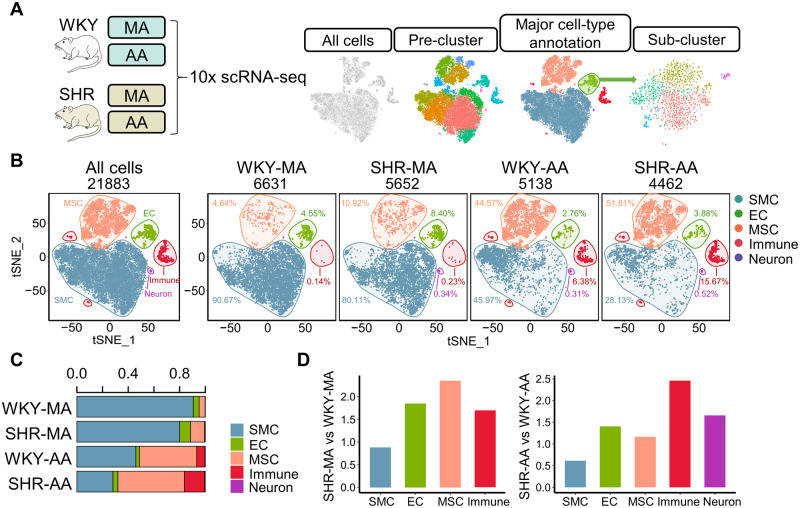
Figure 1.
Transcriptomic atlas of WKY and SHR MA and AAs. (A) Experimental design and analysis pipeline. (B) Integrated and split view of the scRNA-seq datasets from WKY and SHR AA and MA. Cells were from pooled MA or AA samples of eight WKY rats or seven SHRs. Cell number: WKY-MA, n = 6631 cells from 8 WKY rats; SHR-MA, n = 5652 cells from 7 SHRs; WKY-AA, n = 5138 cells from 8 WKY rats; SHR-AA, n = 4462 cells from 7 SHRs. (C) Percentage of major cell types in each dataset. (D) Percentage shift of major cell types in AA and MA in SHRs compared with WKY rats. AA, aortic artery; EC, endothelial cell; MA, mesenteric artery; MSC, mesenchymal stromal cell; SHR, spontaneously hypertensive rats; SMC, smooth muscle cell; WKY, Wistar Kyoto.

