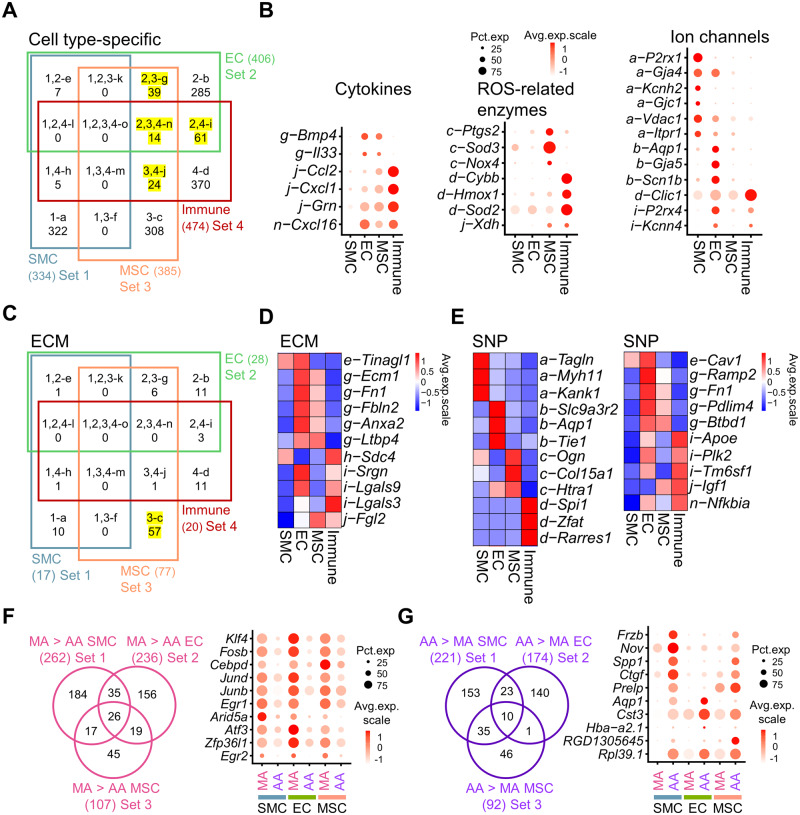
Figure 2.
Cell type- and artery type-specific genes of WKY rat AA and MA. (A) Venn diagram of cell type-specific genes (average fold change > 1.5, P-value < 0.01 determined by Wilcoxon rank-sum tests). Yellow highlighted Venn diagram parts g, i, j, and n demonstrate the overlap of EC, MSC, and immune cell type-specific genes. (B) Dot plot of genes in indicated Venn diagram parts of (A) in selected gene classifications (cytokines, ROS-related enzymes, and ion channels). (C) Venn diagram of cell type-specific genes that belong to ECM classification. Highlighted Venn diagram part c showed the number of ECM genes exclusively expressed in MSCs. (D) Average expression heatmap of top five genes in Venn diagram parts e–o of (C). (E) Average expression heatmap of top three SNP genes in Venn diagram parts a–d and all SNP genes from Venn diagram part e–o from (A). (F and G) Venn diagram of genes expressed higher in WKY-MA SMCs, ECs, and MSCs in comparison with WKY-AA analogue (F) or genes expressed higher genes in WKY-AA SMCs, ECs, and MSCs in comparison with WKY-MA analogue (G). Cells were from pooled MA or AA samples of eight WKY rats. Cell number: MA SMC, n = 6012 cells; AA SMC, n = 2362 cells; MA EC, n = 302 cells; AA EC, n = 142 cells; MA MSC, n = 308 cells; AA MSC, n = 2291 cells. Dot plot of selected genes from the central Venn diagram part which were expressed higher in all three cell types. AA, aortic artery; EC, endothelial cell; ECM, extracellular matrix; MA, mesenteric artery; MSC, mesenchymal stromal cell; SMC, smooth muscle cell; SNP, single nucleotide polymorphism.

