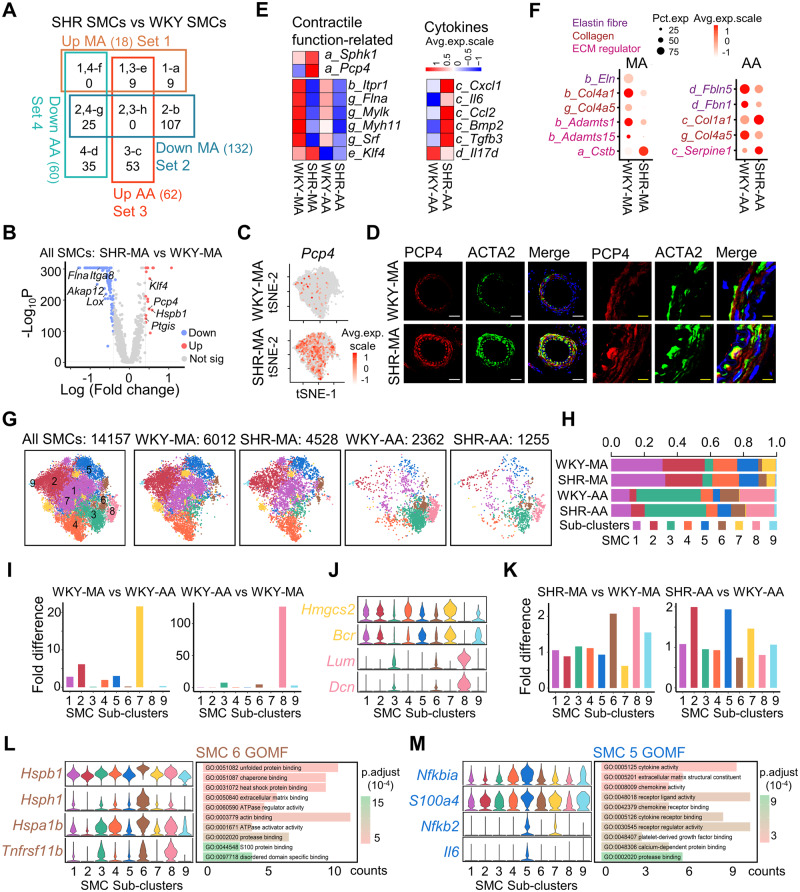
Figure 3.
Artery-specific transcriptomic changes and sub-cluster alterations in SMCs during hypertension. (A) Venn diagram of dysregulated genes (average fold change > 1.5, P-value < 0.01) in MA and AA SMCs from SHRs with WKY counterparts as controls. SMC cell number: WKY-MA, n = 6012 cells from 8 WKY rats; SHR-MA, n = 4528 cells from 7 SHRs; WKY-AA, n = 2362 cells from 8 WKY rats; SHR-AA, n = 1255 cells from 7 SHRs. Character before the underscore indicates corresponding Venn diagram part. (B) Volcano plot of differentially expressed genes (average log fold change > 0.41, average fold change > 1.5, P value < 0.01 determined by Wilcoxon rank-sum tests) in SHR-MA SMCs in comparison with WKY counterparts. SMC cell number: WKY-MA, n = 6012 cells from 8 WKY rats; SHR-MA, n = 4528 cells from 7 SHRs. (C) Feature plot showing the expression of PCP4 in MA of WKY rat and SHR. (D) Immunostaining of PCP4 and ACTA2 in MA of WKY rat and SHR. White scale bar, 50 μm; and yellow scale bar, 10 μm. (E) Average expression heatmap of selected dysregulated genes from corresponding Venn diagram parts of (A). (F) Dot plot of selected ECM genes from corresponding Venn diagram parts of (A). (G) TSNE plot showing the distribution of sub-clusters in all SMCs and in each dataset. (H) Percentage of each sub-cluster in each dataset. (I) Sub-cluster percentage fold difference in WKY rat MA and AA. (J) Violin plot showing the expression of indicated markers in each sub-cluster. (K) EC sub-cluster percentage fold difference in SHR MA and AA in comparison with WKY rat counterpart. (L and M) Violin plot showing the expression of markers in indicated sub-cluster and GOMF analysis of sub-cluster-specific genes. AA, aortic artery; GOMF, gene ontology molecular function; MA, mesenteric artery; SHR, spontaneously hypertensive rats; SMC, smooth muscle cell; tSNE, t-distributed stochastic neighbour embedding; WKY, Wistar Kyoto.

