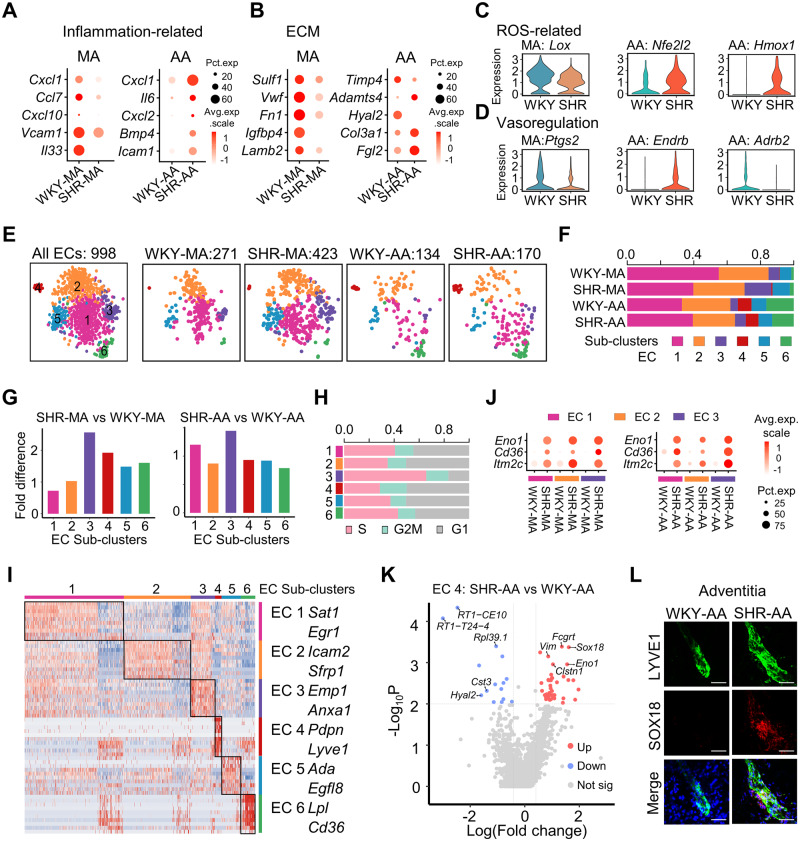
Figure 4.
Artery-specific transcriptomic changes and sub-cluster alterations in ECs of SHRs. (A and B) Dot plot showing the expression of selected significantly differentially expressed genes (P < 0.01 determined by Wilcoxon rank-sum tests) in WKY or SHR ECs from MA or AA. EC cell number: WKY-MA, n = 302 cells from 8 WKY rats; SHR-MA, n = 475 cells from 7 SHRs; WKY-AA, n = 142 cells from 8 WKY rats; SHR-AA, n = 173 cells from 7 SHRs. (C and D) Violin plot showing the expression of selected differentially expressed (P < 0.01 determined by Wilcoxon rank-sum tests) genes in WKY or SHR ECs from MA or AA. EC cell number: WKY-MA, n = 302 cells from 8 WKY rats; SHR-MA, n = 475 cells from 7 SHRs; WKY-AA, n = 142 cells from 8 WKY rats; SHR-AA, n = 173 cells from 7 SHRs. (E) TSNE plot showing the distribution of sub-clusters in all ECs and in each dataset. (F) Percentage of each sub-cluster in each dataset. (G) EC sub-cluster percentage fold difference in SHRs with WKY rats as control in MA and AA. (H) Percentage of cells at different stages of cell cycle in each sub-cluster. (I) Heatmap showing EC sub-cluster identity and the top 10 EC sub-cluster genes (by average fold change). (J) Dot plot showing indicated genes upregulated in SHRs in EC sub-clusters 1–3 of MA and AA compared to WKY controls. (K) Volcano plot of differentially expressed genes (average log fold change > 0.41, average fold change > 1.5, P-value < 0.01) in AA EC4 sub-cluster (lymphatic ECs) from SHRs compared to WKY rats. EC sub-cluster 4 cell number: WKY-AA, n = 11 cells; SHR-AA, n = 13 cells. (L) Immunostaining of LYVE1 and SOX18 in WKY and SHR-AA adventitia. Scale bar, 50 μm. AA, aortic artery; EC, endothelial cell; MA, mesenteric artery; SHR, spontaneously hypertensive rats; SMC, smooth muscle cell; WKY, Wistar Kyoto.

