Figure 6.
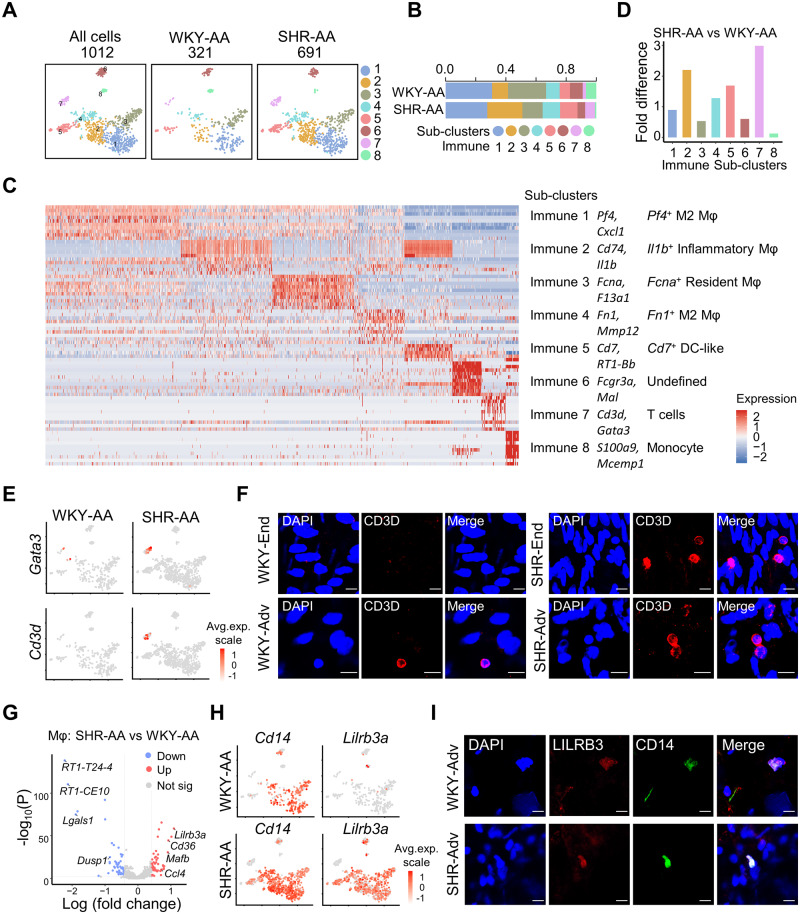
Immune cell heterogeneity and responses in hypertension. (A) TSNE plot showing the distribution of sub-clusters in all immune cells and in each dataset. (B) Percentage of each immune sub-cluster in each dataset. (C) Heatmap of top 10 significantly changed genes (by average log fold change) in each immune cell sub-cluster. (D) Sub-cluster percentage fold difference in WKY mesenteric artery and AA. (E) Feature plot showing the expression of Gata3 and Cd3d in AA from WKY rat and SHR. (F) Immunostaining of CD3D in AA intima and adventitia. Scale bar, 10 μm. (G) Volcano plot of differentially expressed genes (average log fold change > 0.41, average fold change > 1.5, P-value < 0.01) in macrophages (immune sub-clusters 1–4) in WKY-AA and SHR-AA datasets. Total cell number of macrophages: WKY-AA, n = 243 cells from 8 WKY rats; SHR-AA, n = 525 cells from 7 SHRs. (H) Feature plot showing the expression of Cd14 and Lilrb3a in WKY-AA and SHR-AA. (I) Immunostaining of LILRB3 and CD14 in WKY and SHR aortic adventitia. Scale bar, 10 μm. AA, aortic artery; DC-like, dendritic cell-like; Mφ, macrophages; SHR, spontaneously hypertensive rats; WKY, Wistar Kyoto.

