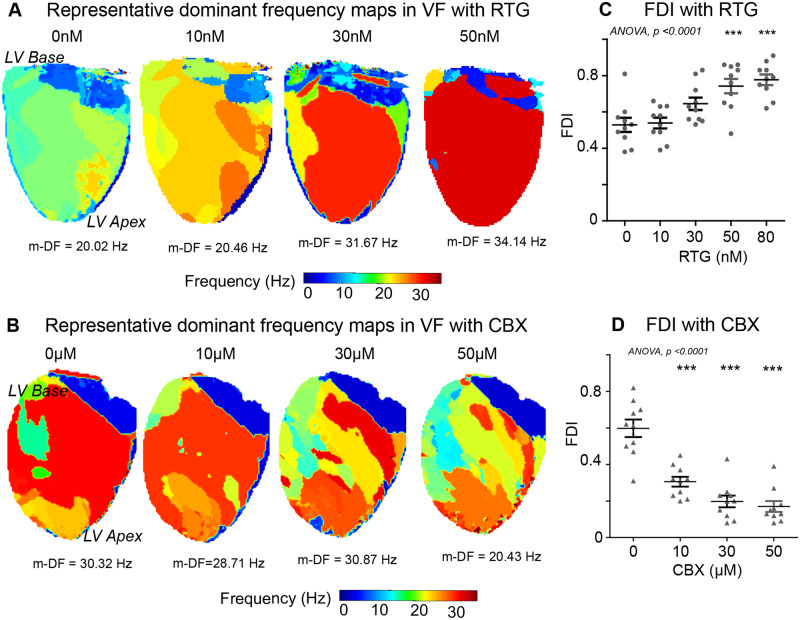
Figure 3.
Enhanced GJ coupling increases the global fibrillatory organization. Representative DF maps in response to (A) RTG and (B) CBX in VF. The DF of the largest organized region or the m-DF is indicated below in hertz (Hz). (C) A graph showing an increase in the FDI in RTG-treated hearts in comparison to (D) decrease with CBX. Data from RTG (n = 10) and CBX (n = 10) hearts. Statistical analysis with repeated measures ANOVA, post hoc Bonferroni, P-values are in comparison to baseline, ***P < 0.001. m-DF, maximal DF.

