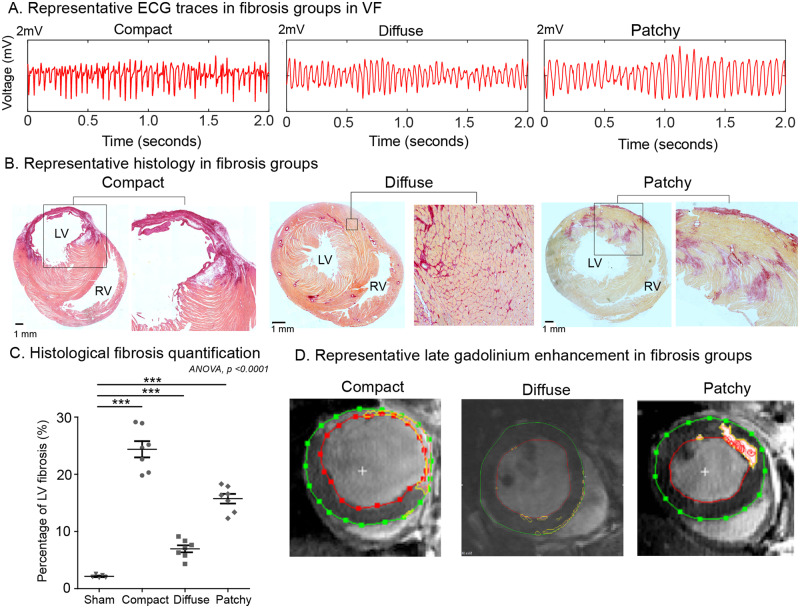
Figure 4.
Validation of differing ventricular fibrosis models. (A) Representative ECG traces in differing fibrosis models in VF. (B) Representative mid-LV axial histological sections of fibrotic areas (dark red) and normal tissue (orange to pink), scale—black bar corresponds to 1 mm. (C) Histological LV fibrosis quantification. (D) Representative mid-LV short-axis slices with LGE. Data in (C) from select hearts; sham (n = 4), CF (n = 7), DiF (n = 7), and PF (n = 7) hearts. Statistical analysis with ANOVA post hoc Bonferroni multiple comparisons test, ***P < 0.001.

