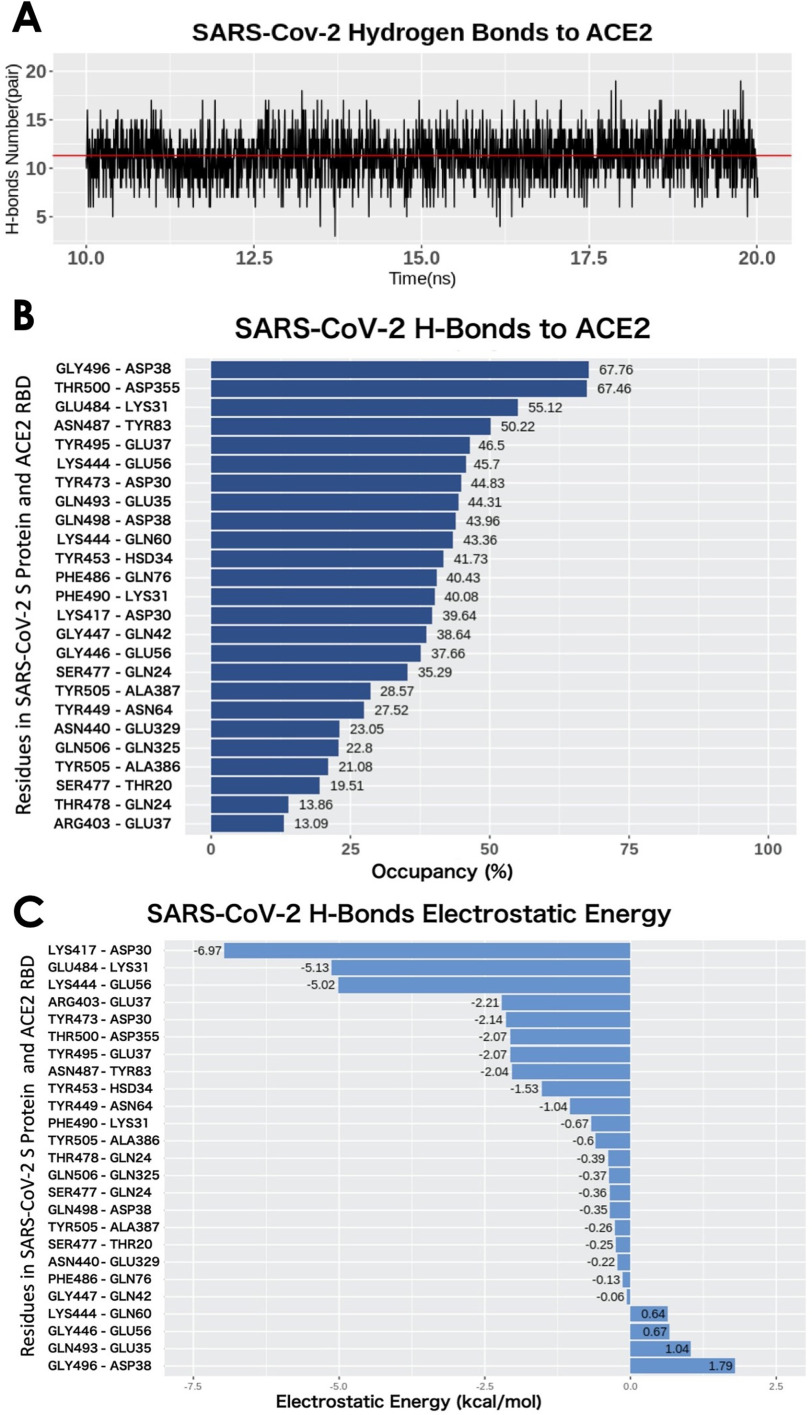
Figure 4.
H-bonds between SARS-CoV-2 RBD and ACE2 binding domain. (A) Numbers of H-bonds at different time stamps from 10 to 20 ns, the average value is marked as red line with the value of 11.30. (B) Occupancy of H-bonds ordered by decreasing values of occupancy, and the residues are labeled in y-axis with the SARS-Cov-2 in the left and ACE2 in the right. (C) List of hydrogen bonds that are ranked by their electrostatic energy values.

