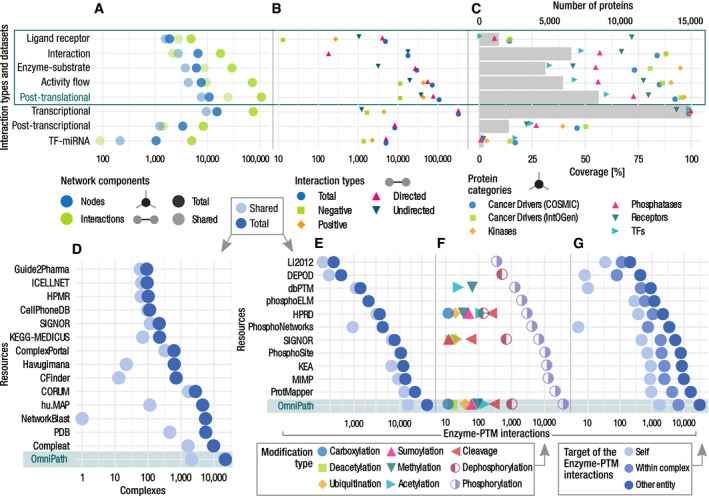
Networks by interaction types and the network datasets within the PPI network. (A) Number of nodes and interactions. The light dots represent the shared nodes and edges (in more than one resource), while the dark ones show their total numbers. (B) Causality: number of connections by direction and effect sign. (C) Coverage of the networks on various groups of proteins. Dots show the percentage of proteins covered by network resources for the following groups: cancer driver genes from COSMIC and IntOGen, kinases from kinase.com, phosphatases from Phosphatome.net, receptors from the Human Plasma Membrane Receptome (HPMR) and transcription factors from the TF census. Gray bars show the number of proteins in the networks. The information for individual resources is in Figs
EV1 and
EV2, Appendix Fig
S1.