
Figure 5. Illustrations of the integrated analysis of inter‐ and intracellular signaling.
- Inter‐ and intracellular signaling interactions linking the top predicted ligands over‐expressed after SARS‐CoV‐2 infection to their potential immune response targets in the Calu3 cell line. Top ranked ligands (orange) connect to their potential receptors (turquoise) that trigger an intracellular cascade until reaching TFs (purple), that in turn regulate the expression of the target genes (blue). Signaling intermediates (gray) connect receptors to TFs across their shortest path.
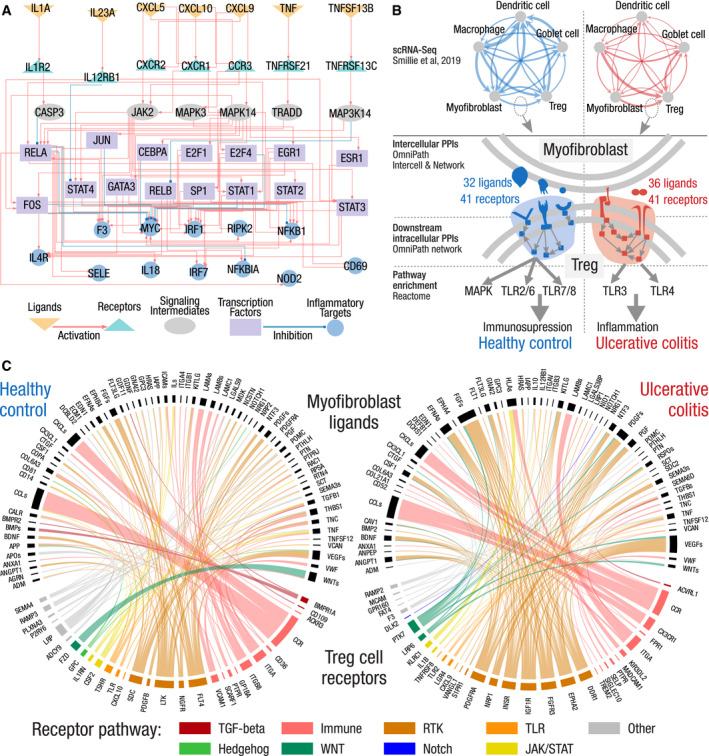
- Intercellular connections and their downstream effect in UC compared with healthy control. Top: communication network of five cell types reconstructed from scRNA‐Seq; the thickness of the edges is proportional to the number of intercellular connections. Bottom: condition‐specific ligand–receptor connections between myofibroblasts and regulatory T cells trigger an immunosuppressive versus an inflammatory signaling in T cells, in healthy and UC, respectively.
- Condition‐specific connections between myofibroblast ligands (upper semicircles, black) and Treg cell receptors (lower semicircles, colored by pathways) in ulcerative colitis (right) and healthy control (left). Pathway annotations from SignaLink. Immune—innate immune response, RTK—receptor tyrosine kinase, TLR—Toll‐like receptor.