Fig. 1.

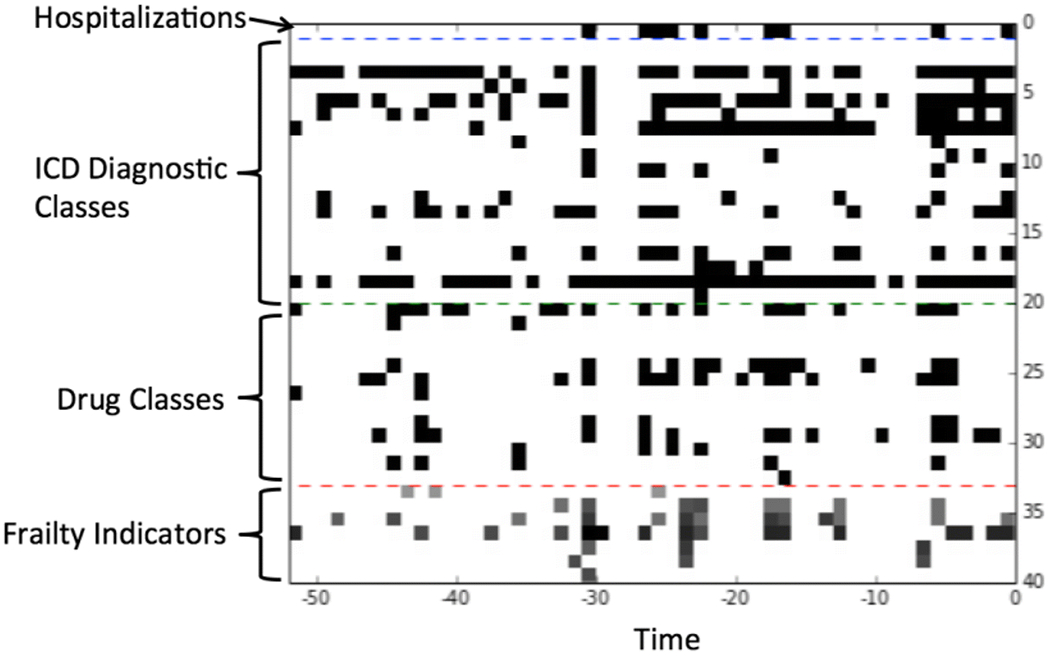
An example of the temporal images. The x-axis is the time (in weeks) within the 2 years prior to the discharge date of the index hospitalization. The y-axis is the list of temporal variables.

An example of the temporal images. The x-axis is the time (in weeks) within the 2 years prior to the discharge date of the index hospitalization. The y-axis is the list of temporal variables.