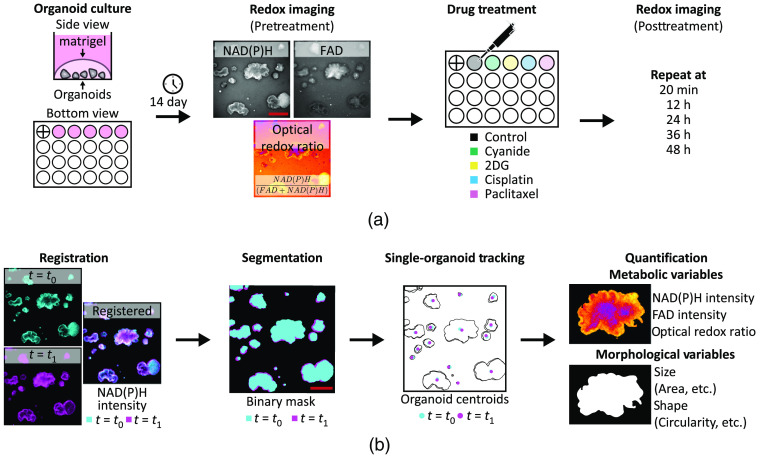
Fig. 1.
Redox imaging of PCOs. An overview of the protocol for redox imaging and quantitative image analysis. (a) Graphical protocol showing the culturing of PCOs, pretreatment redox imaging, drug treatment, and posttreatment redox imaging time course. Redox imaging uses pairs of NAD(P)H and FAD fluorescence images from the same field-of-view to calculate the ORR image [NAD(P)H/(FAD + NAD(P)H)]. “+” in first well indicates registration mark. (b) Graphical representation of the image analysis pipeline, which includes registration of all frames in each image time series, organoid segmentation, single-organoid tracking, and quantification of metabolic and morphological variables to capture PCO drug response at each time point. Scale bar: .

