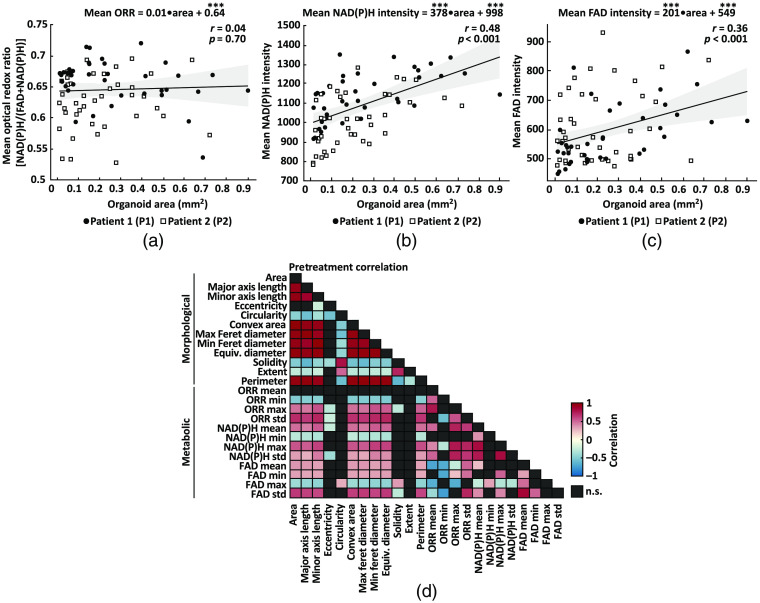
Fig. 3.
Analysis of organoid-level redox imaging variables. Analysis of variables extracted from all PCOs pretreatment. (a) Linear regression was used to quantify the relationship between organoid area and its mean ORR. The fitted model indicates the mean ORR value of each PCO is independent of its area (, ) for all PCOs from patient 1 (P1) and patient (P2) pretreatment. Statistical significance of the model coefficients is indicated as *** for . (b) Linear regression was used to quantify the relationship between organoid area and its mean NAD(P)H intensity. The fitted model indicates a moderate positive correlation (, ) between organoid area and mean NAD(P)H intensity. (c) Linear regression was used to quantify the relationship between organoid area and its mean FAD intensity. The fitted model indicates a moderate positive correlation (, ) between organoid area and mean FAD intensity. (d) Linear pairwise correlation (Pearson’s ) matrix of the variables extracted from each PCOs. Heatmap shows only statistically significant correlations (); n.s., not significant (, black boxes). Table 1 shows the number of PCOs in each treatment group for each patient.

