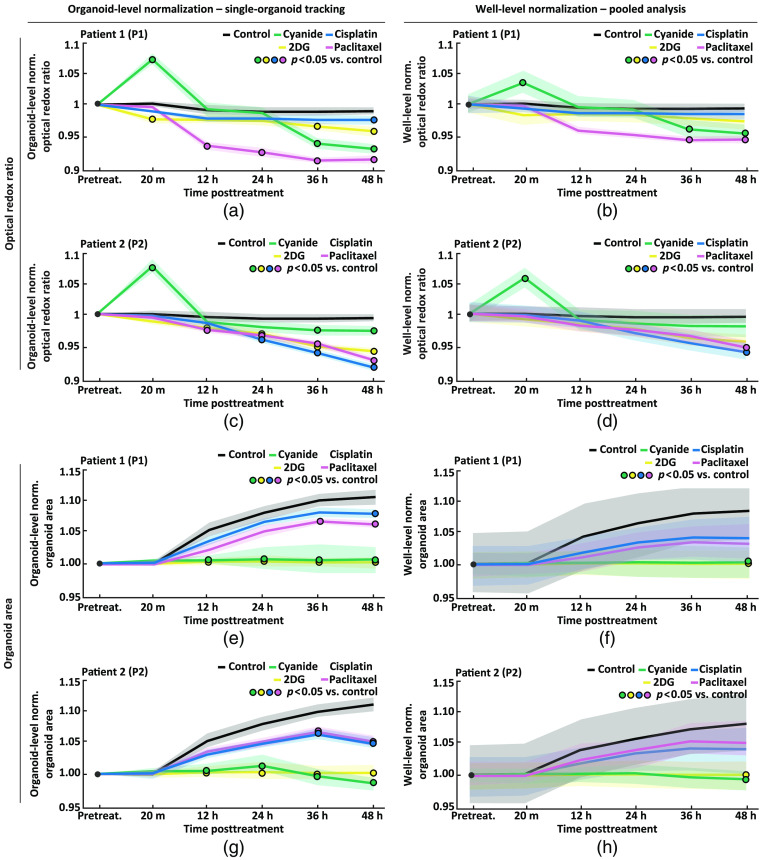
Fig. 6.
Comparison of single-organoid tracking and pooled analysis. Comparison of single-organoid tracking and pooled analysis using time series data from patient 1 (P1) and patient 2 (P2). Normalization refers to dividing the value of each organoid at each time point by either its own pretreatment value (organoid-level normalization) or the well-level mean (well-level normalization). (a), (b) Pretreatment normalized ORR using organoid-level normalization (left) and well-level normalization (right) for each treatment group for P1. (c), (d) Pretreatment normalized ORR using organoid-level normalization (left) and well-level normalization (right) for each treatment group for P2. (e), (f) Pretreatment normalized organoid area using organoid-level normalization (left) and well-level normalization (right) for each treatment group for P1. (g), (h) Pretreatment normalized organoid area using organoid-level normalization (left) and well-level normalization (right) for each treatment group for P2. Data in (a), (c), (e), (g) were analyzed using a linear mixed-effect model that uses single-organoid tracking to account for organoid-level variability. Data in (b), (d), (f), (h) were analyzed using a linear mixed-effect model that does not account for organoid-level variability due to the lack of single-organoid tracking. Data plotted are mean (lines) ± standard error of the mean (shaded area). Significant differences between a treatment and control () are indicated with a circle color-coded for the treatment group (see legend). Table 1 shows the number of PCOs in each group and for each patient.

