FIGURE 5:

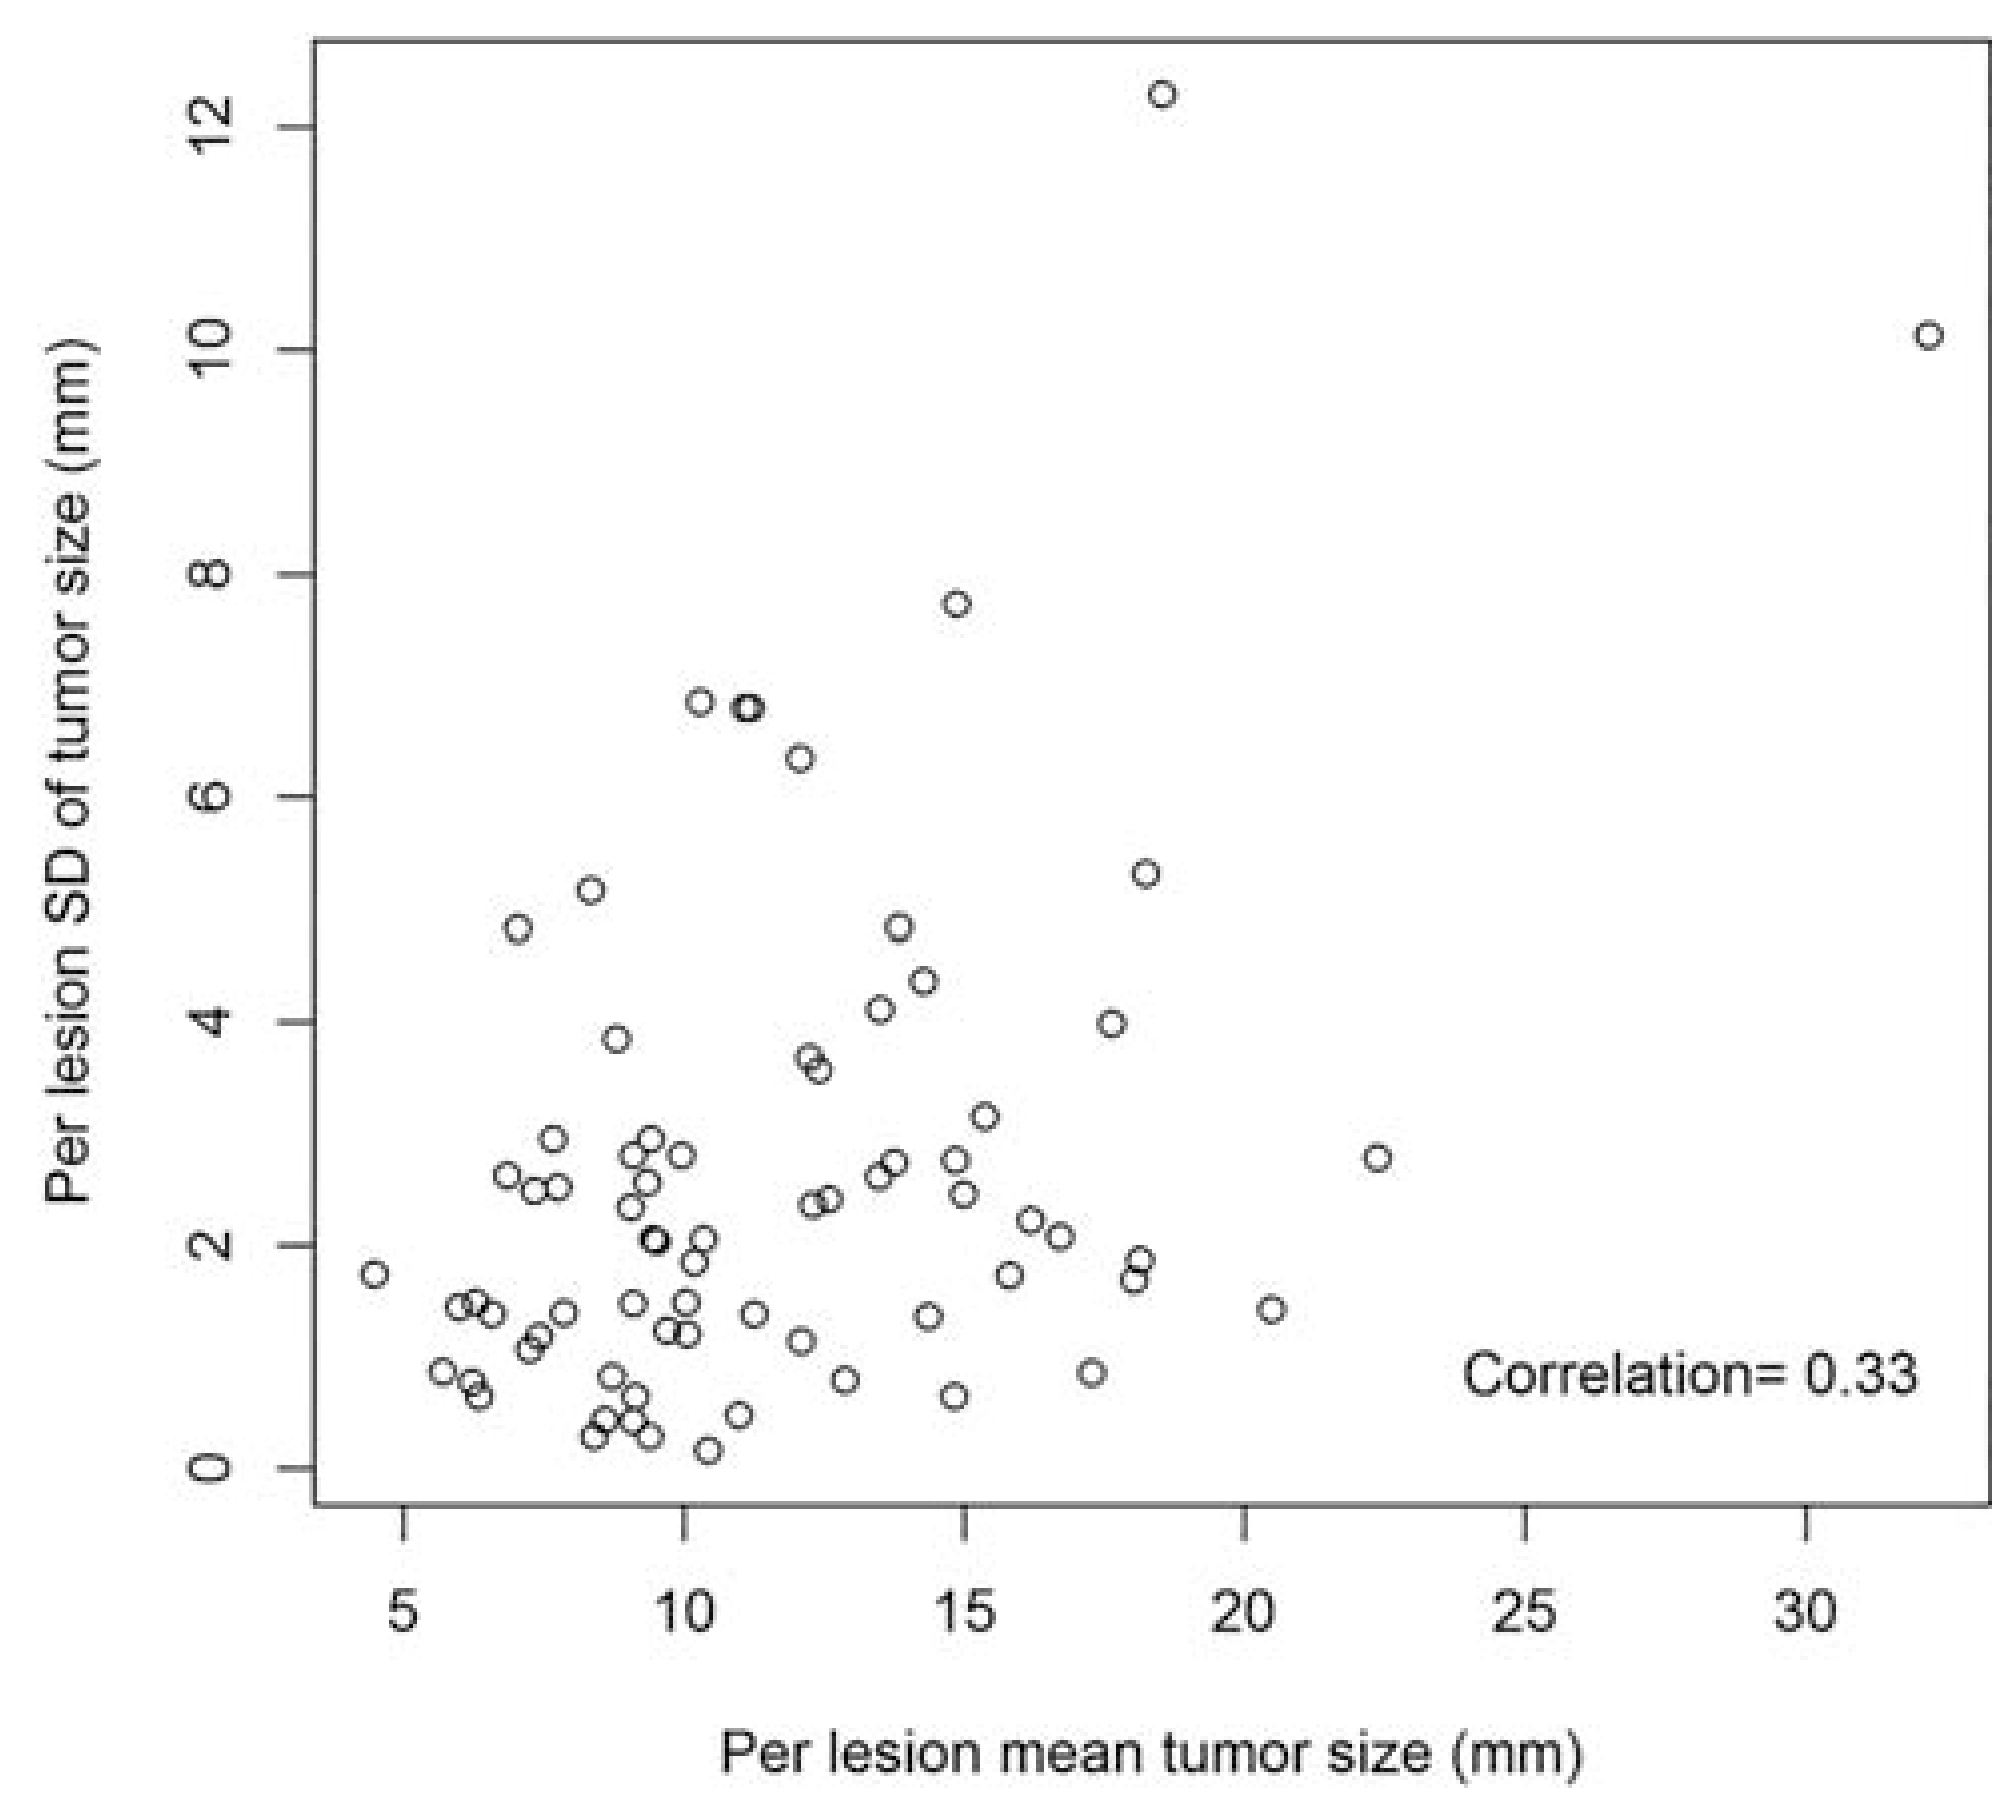
Plot of mean tumor size and standard deviation (SD) as measured by radiologists. Variability between radiologists tended to increase with increasing tumor size, but with a weak correlation.

Plot of mean tumor size and standard deviation (SD) as measured by radiologists. Variability between radiologists tended to increase with increasing tumor size, but with a weak correlation.