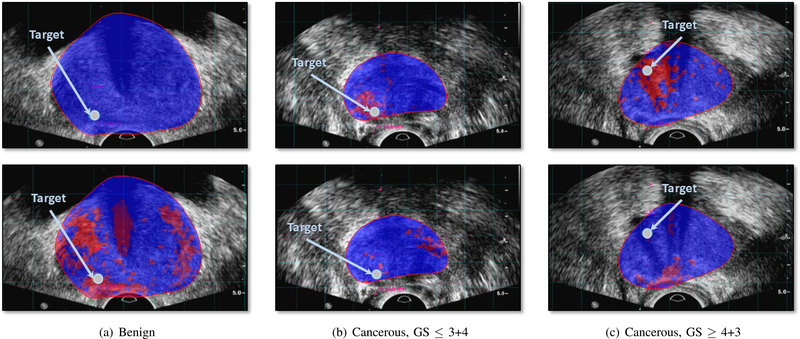
Fig. 6.
Cancer likelihood maps overlaid on B-mode ultrasound images, along the projected needle path in the TeUS data, and centered on the target. Red indicates predicted labels as cancer, and blue indicates predicted benign regions. The boundary of the segmented prostate in MRI is overlaid on TRUS data. The arrow points to the target location. The top row shows the result of LSTM and the bottom row shows the result of spectral analysis [17] for benign targets (a), and cancer targets (b) and (c).

