
Fig. 3.
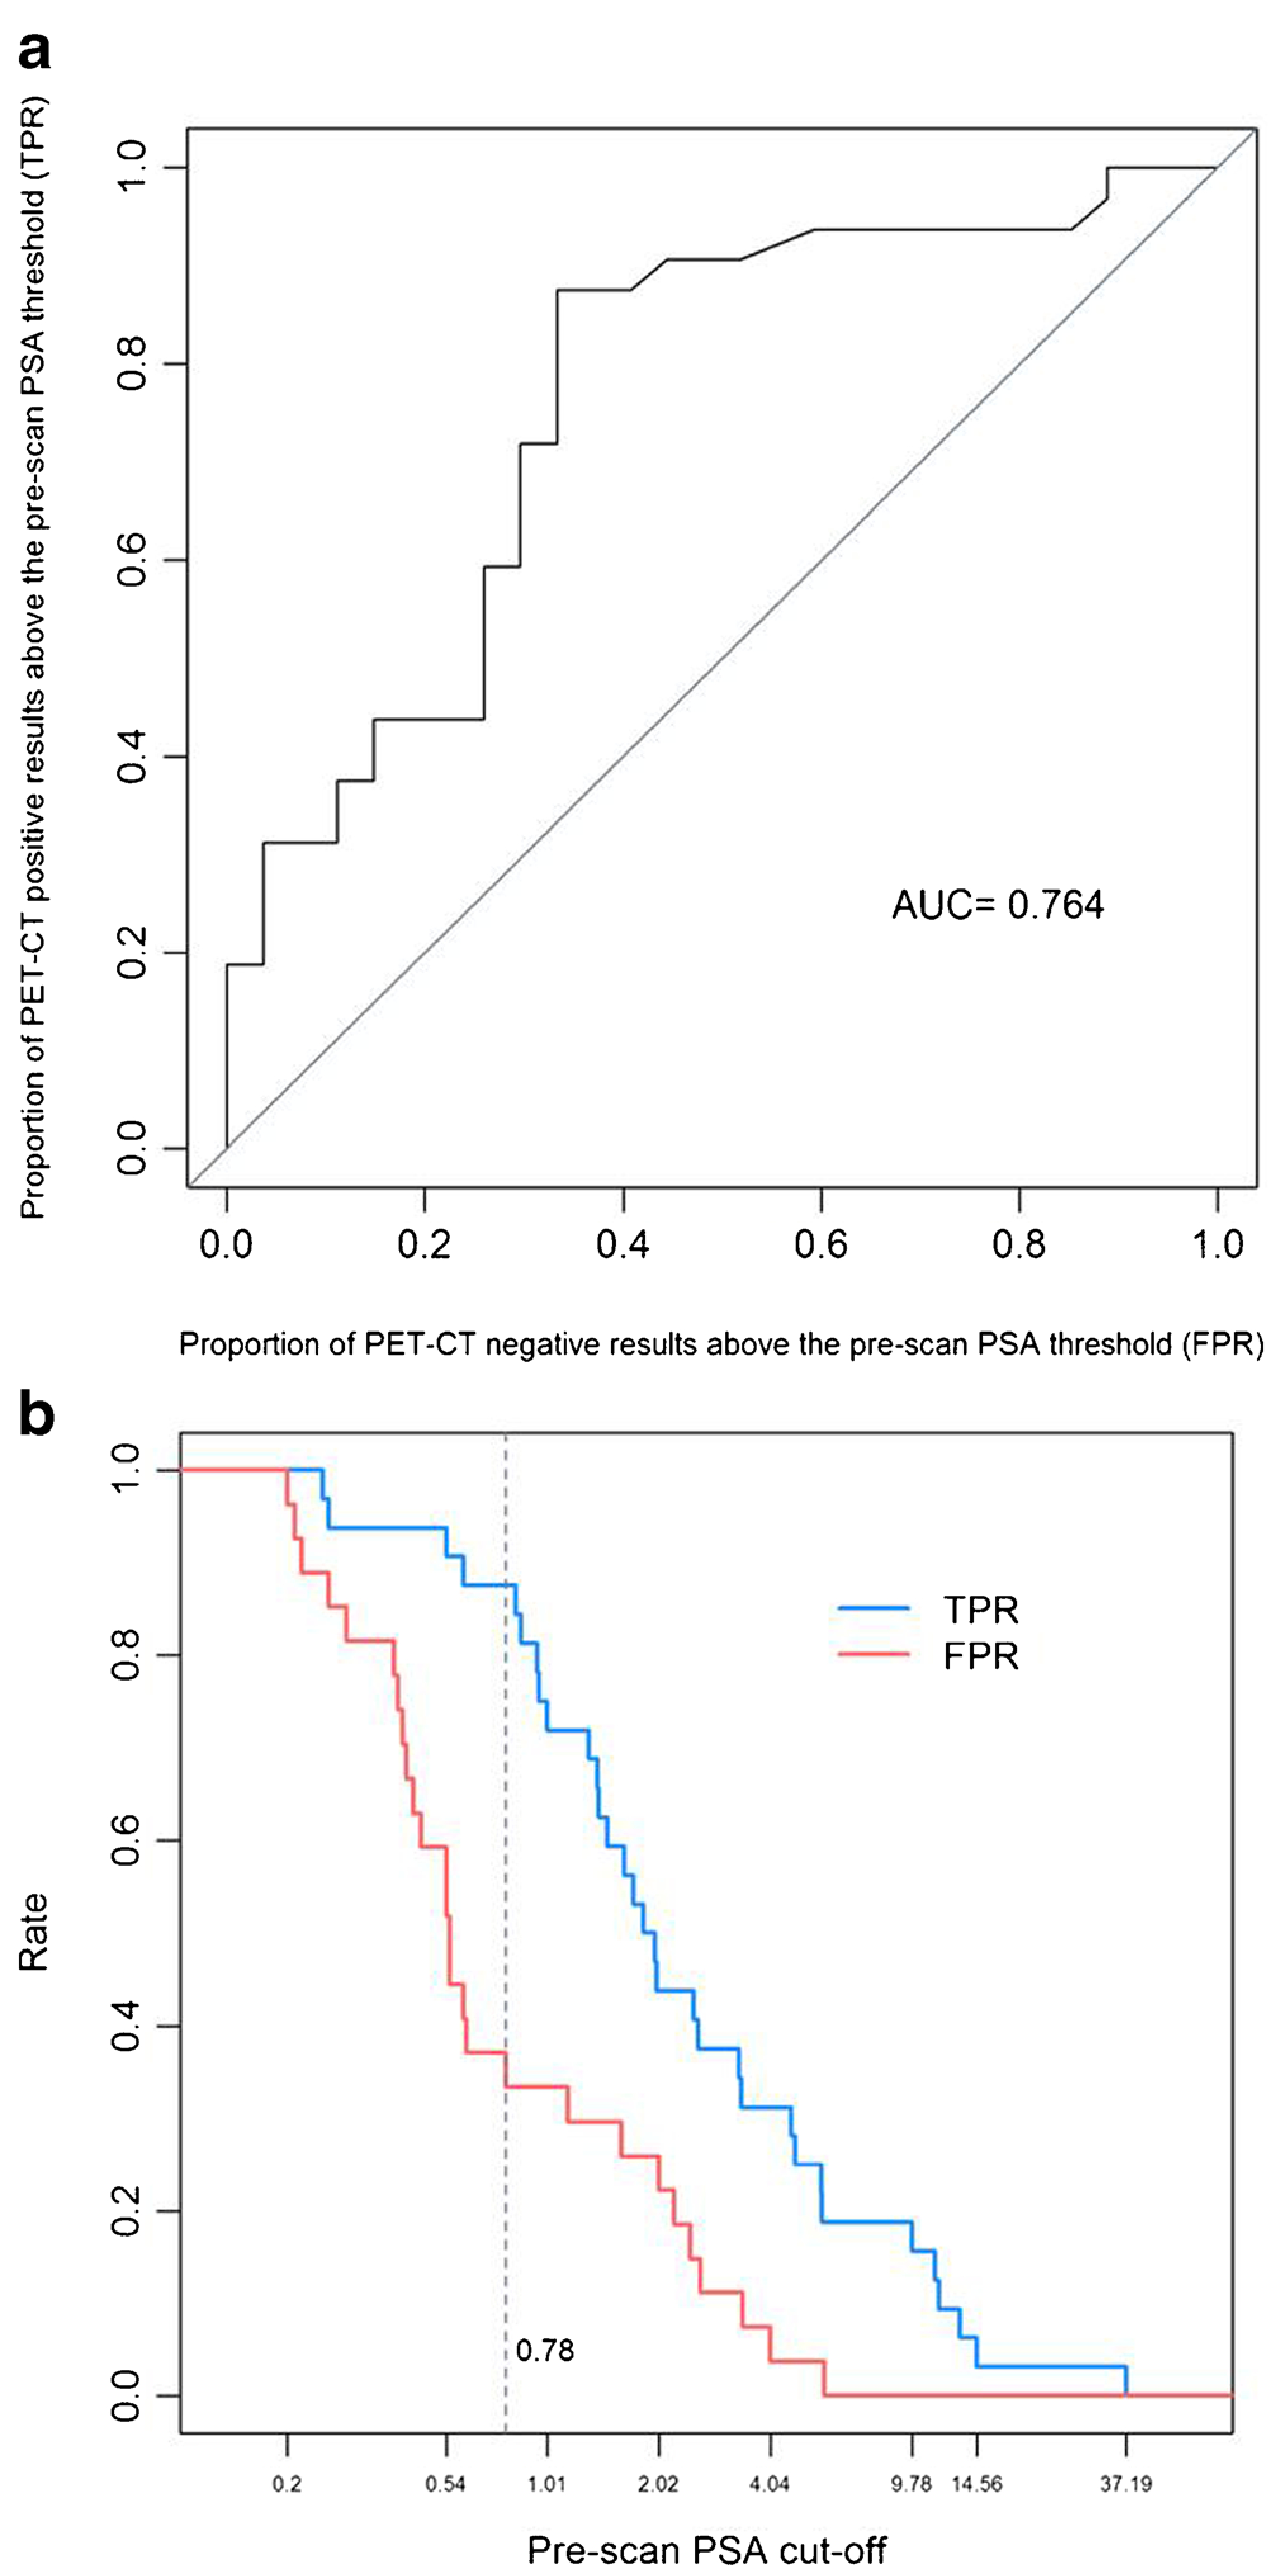
a. ROC analysis performed for surgical patients (n = 59) to assess the ability of pre-scan PSA in distinguishing between 18F–DCFBC PET/ CT positive and negative result, with an AUC (area under the operating characteristic curve) of 76.4%. b. The optimal cut-off pre-scan PSA, which maximizes the difference between the true-positive rate (TPR) and the false-positive-rate (FPR), was 0.78 ng/mL, i.e., at pre-scan PSA of 0.78 ng/mL, TPR was 87.5% (28/32) and FPR was 33.3% (9/27)