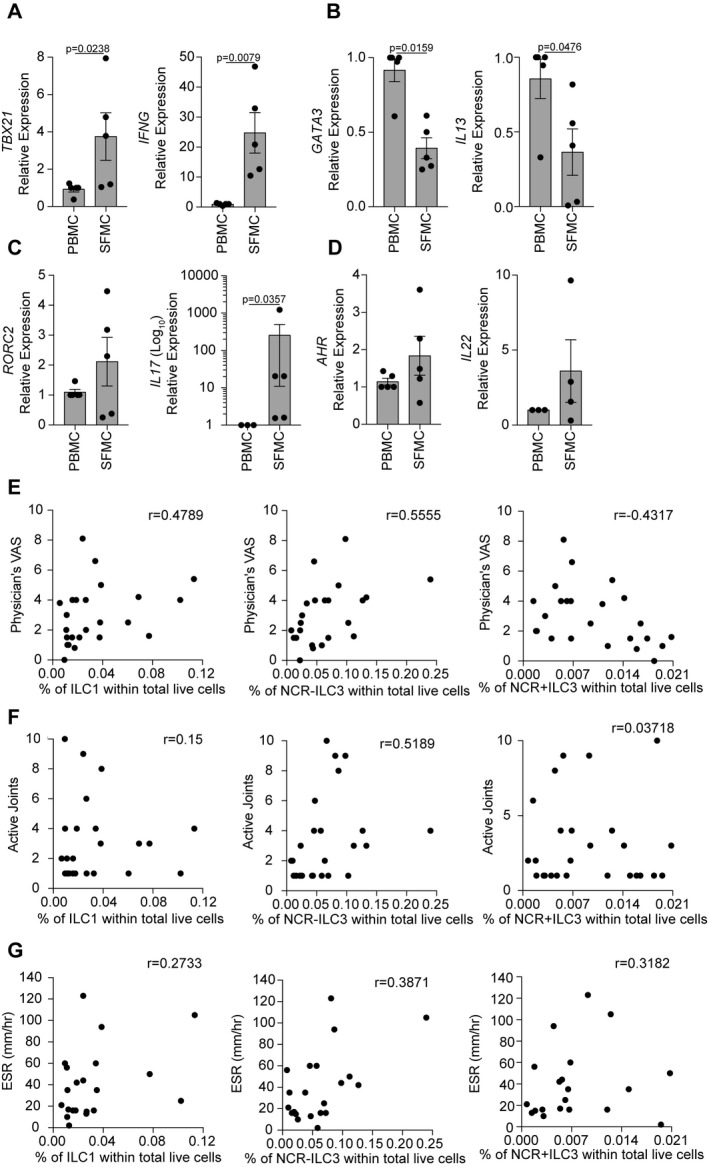
Figure 2.

Changes in ILC subset frequency within total ILCs within SFMCs are associated with changes in transcriptional profile and in clinical severity. A–D, Summary scatterplots with bar charts showing the relative expression of TBX21 and IFNG (A), GATA3 and IL13 (B), RORC2 and IL17A (C), and AHR and IL22 (D) in SFMCs (n = 5 patients) and PBMCs (n = 5 patients) as measured by quantitative reverse transcriptase–polymerase chain reaction. Symbols represent individual patients; bars show the mean ± SEM. Significance was determined by Mann‐Whitney U tests. E–G, Scatterplots showing the relationships of the physician's global assessment of disease activity on a visual analog scale (VAS) (n = 24 patients) (E), the number of joints with active disease (n = 27 patients) (F), and the erythrocyte sedimentation rate (ESR) (n = 18 patients) (G) with the frequency of ILC1s, NCR− ILC3s, and NCR+ ILC3s within total live cells within JIA SFMCs at the time of sampling. Significance was determined by Spearman correlation with Bonferroni correction for multiple testing. See Figure 1 for other definitions.
