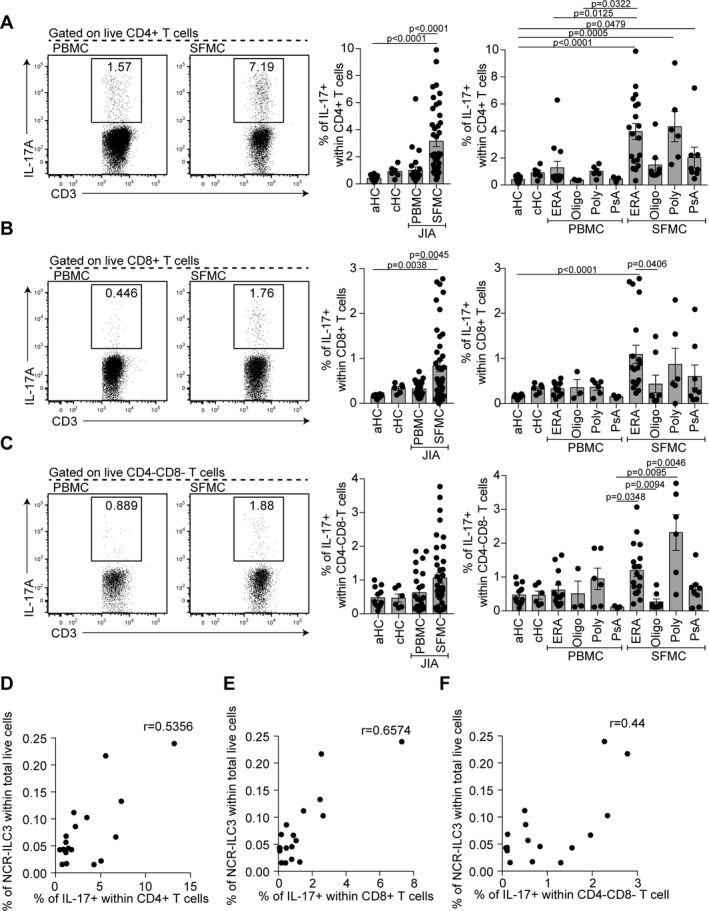
Figure 3.

Interleukin‐17A (IL‐17A)–producing CD4+, CD8+, and γδ T cells in SF of patients with JIA. A–C, Representative flow cytometry plots and summary scatterplots with bar charts showing the frequency of IL‐17A+ cells within CD4+ T cells (A), CD8+ T cells (B), and CD4−CD8− T cells (C) in CD3+ gated live cells in PBMCs from healthy adults (n = 12), PBMCs from healthy children (n = 6), PBMCs from JIA patients (total n = 25; 13 with ERA, 3 with oligoarticular JIA, 6 with polyarticular JIA, and 3 with PsA), and SFMCs from JIA patients (total n = 41; 17 with ERA, 8 with oligoarticular JIA, 6 with polyarticular JIA, and 10 with PsA). Symbols represent individual patients; bars show the mean ± SEM. Significance was determined by Kruskal‐Wallis tests with Dunn's multiple comparison tests. D–F, Scatterplots showing the relationships of the frequency of IL‐17A+CD4+ T cells (D), IL‐17A+CD8+ T cells (E), and IL‐17A+CD4−CD8− T cells (F) with the percentage of NCR− ILC3s within total live cells within JIA SFMCs (n = 16 patients). Significance was determined by Spearman correlation with Bonferroni correction for multiple testing. See Figure 1 for other definitions.
