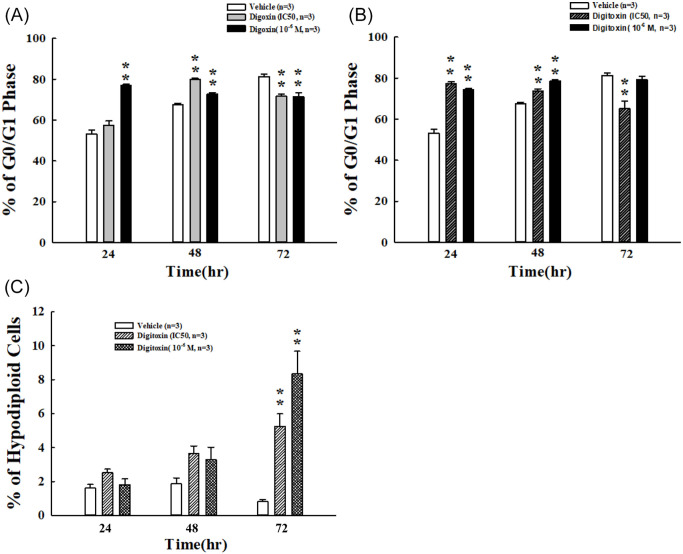
Figure 4.
Distribution of digoxin and digitoxin on cell cycle in SKOV-3 cells. Cells were exposed to (A) digoxin and (B) digitoxin at indicated concentrations for 24, 48, and 72 hours. Flow cytometric analysis was used to detect DNA contents. Percentages of cells in the G0/G1 phase were presented. (C) The percentage of hypodiploid cells incubated with digitoxin at indicated concentrations for 24, 48, and 72 hours were measured under the sub-G1 fraction.
Each value represents mean ± SEM of 3 independent experiments.
**P < .01 as compared with control group.

