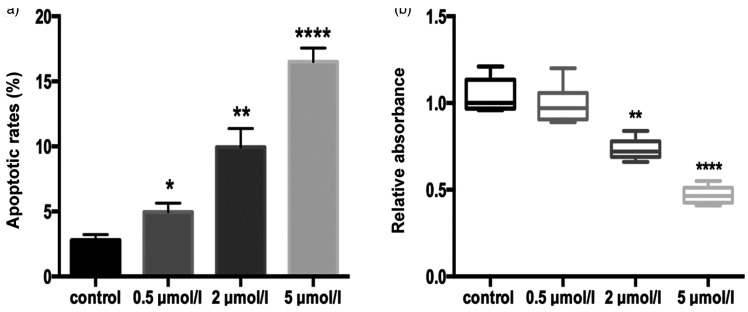
Figure 4.
Cell viability and apoptosis rate in 5-Aza-treated skm-1 cells. (a) Apoptosis rate as measured by flow cytometry in control, 0.5, 2, and 5 µmol/L groups. Significant differences are seen in the apoptosis rate of 2 and 5 µmol/L 5-Aza-treated cells compared with the control (P < 0.01 and P < 0.0001, respectively). (b) Cell viability of skm-1-treated cells assessed via the MTT assay. Significant differences are seen in the relative absorbance of 2 and 5 µmol/L 5-Aza-treated cells compared with the control (P < 0.01 and P < 0.0001, respectively). *, P < 0.05; **, P < 0.01; ***, P < 0.001; ****, P < 0.0001.
5-Aza, 5-aza-2′-deoxycytidine; MTT, 3-(4,5-dimethylthiazol-2-yl)-2,5-diphenyltetrazolium bromide.

