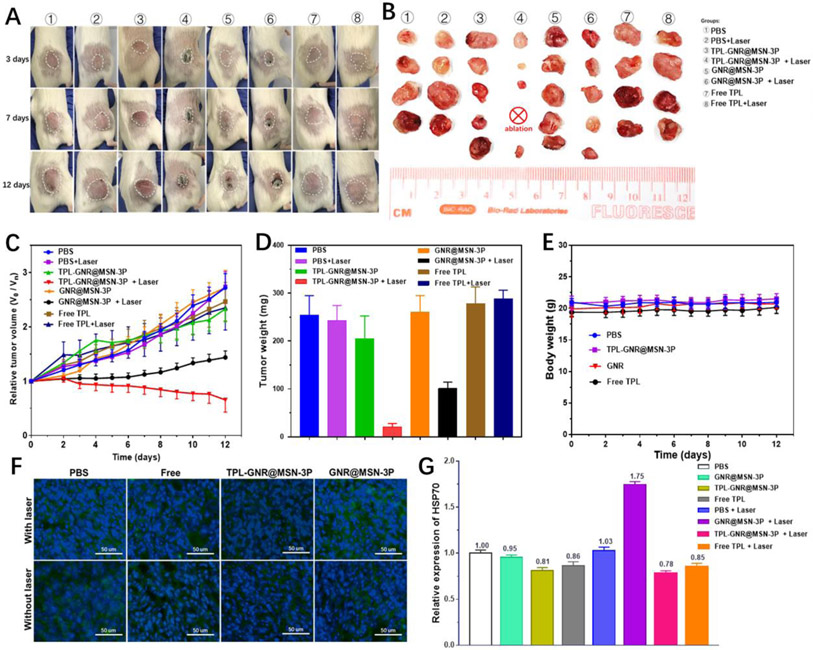
Figure 6.
A) Representative photographs of tumor-bearing mice after various treatments during the 12-d of post treatment. B) Photographs of excised tumors of each group on day 12. C) Tumor growth profiles of 4T1 tumor-bearing the mice treated with various formulations. D) Tumor weight obtained on day 12. E) Body weight changes of 4T1 tumor-bearing mice in different groups. F) Immunofluorescence staining of HSP70 of tumors after different treatments. G) Quantitative analysis of HSP70 in the tumor tissue.

