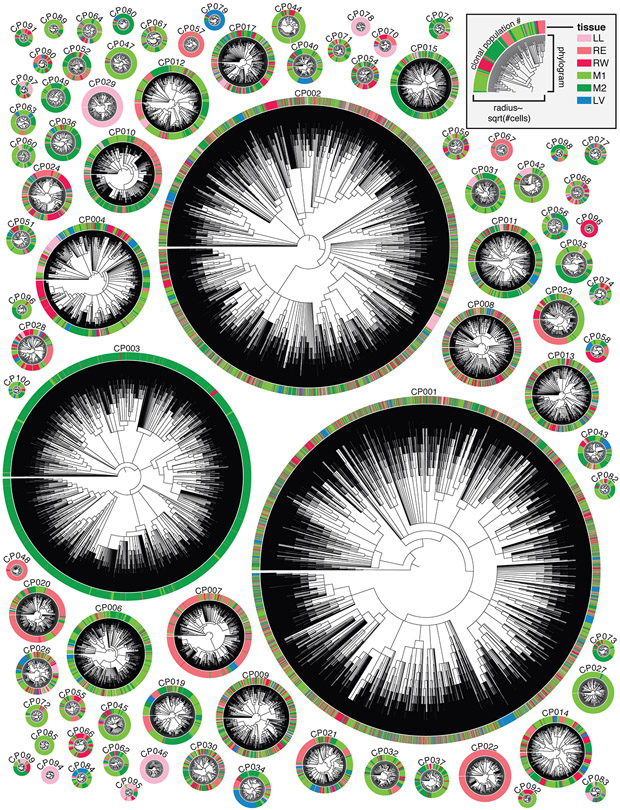
Fig. 2. High-resolution phylogenetic trees capture the histories of clonal cancer populations.
Highly detailed phylogenetic reconstructions for each clonal population, represented as radial phylograms. Each cell is represented along the circumference and colored by tissue, as in Fig. 1E and legend. Trees differ in size, tissue distribution, and frequency of tissue transitions. Each tree is scaled by the square-root of the number of cells.

