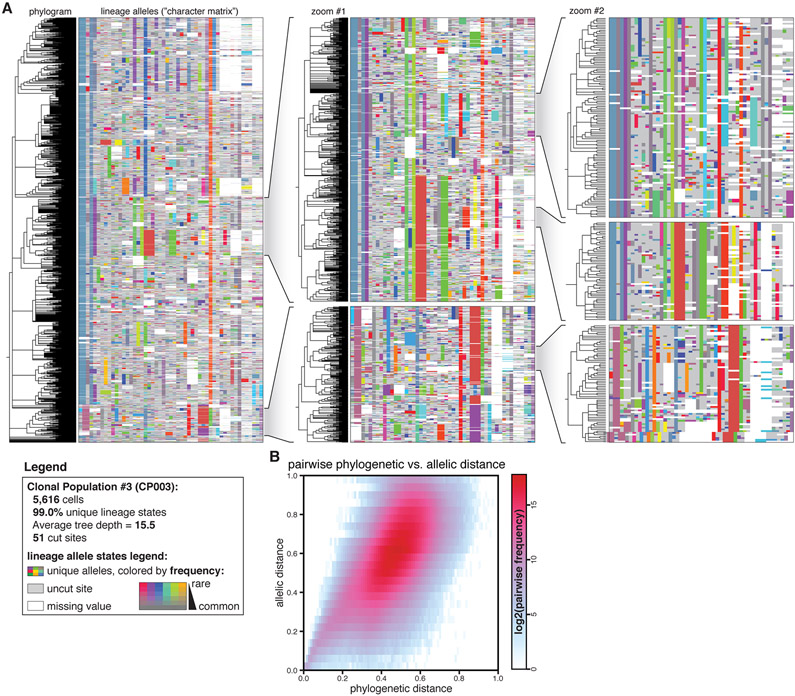
Fig. 3. Phylogenetic reconstructions are detailed and accurate.
(A) Phylogenetic tree and lineage alleles of one clonal population (CP003; N=5,616 cells). The phylogram (left) represents cell–cell relationships and the matrix (right) represents the lineage alleles for each cell. Alleles are uniquely colored, where saturation indicates allele rarity (legend). (A, inlays) Nested zooms of individual clades show the patterns of shared and distinguishing indel alleles, and highlight indel diversity, tree depth, and tree complexity. (B) Correspondence between phylogenetic distance (the normalized pairwise tree distance between two cells) and allelic distance (the normalized pairwise difference in alleles between two cells) for CP003, indicating that the tree accurately models phylogenetic relationships.

