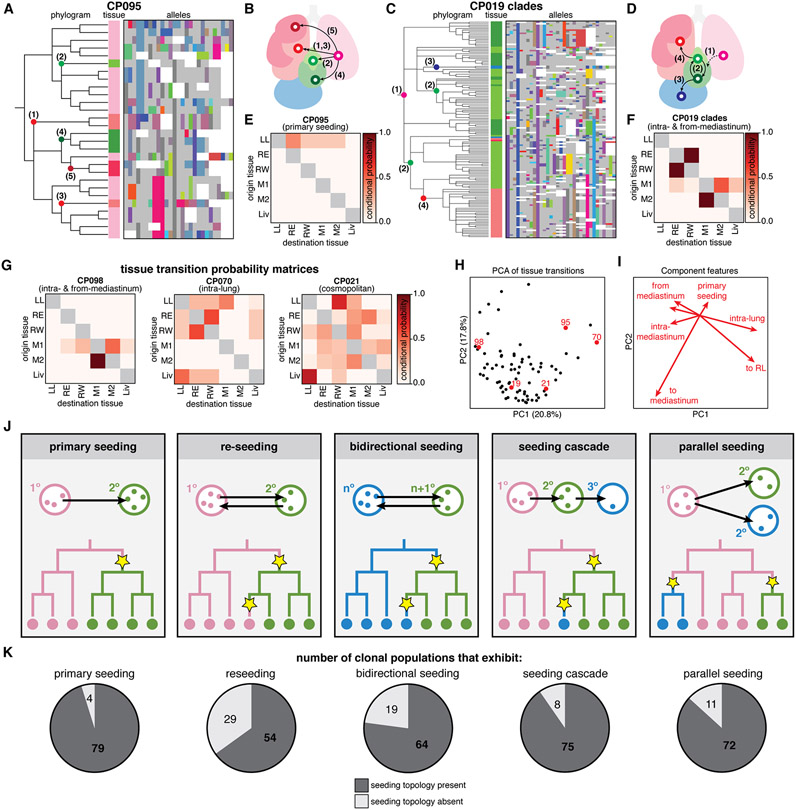
Fig. 7. Metastases were seeded via complex tissue routes and multidirectional topologies.
(A and D) Phylogenetic trees and lineage alleles for clonal population #95 and #19 clades, respectively. Notable metastatic events are annotated in the phylogram and represented graphically as arrows (B and E); cells colored by tissue as in Fig. 1E; lineage alleles colored as in Fig. 3A; dashed arrow indicates an assumed transition. (C and F) Tissue transition matrices representing the conditional probability of metastasizing from and to tissues, defining the tissue routes of metastasis for each clonal population. CP095 solely exhibits primary seeding from the left lung, whereas CP019 shows more complex seeding routes. (G) Tissue transition matrices illustrating the diversity of tissue routes, including metastasis from and within the mediastinum (left), between the lung lobes (middle), or amply to and from all tissues (right). (H) Principal component analysis (PCA) of tissue transition probabilities for each clonal population. Displayed clones are annotated in red; percentage of variance explained by components indicated on axes. (I) Component vectors of PCA with descriptive features. (J) Possible phylogenetic topologies of metastatic seeding, represented as in Fig. 4A. (K) Number of clonal populations that exhibit each metastatic seeding topology.

