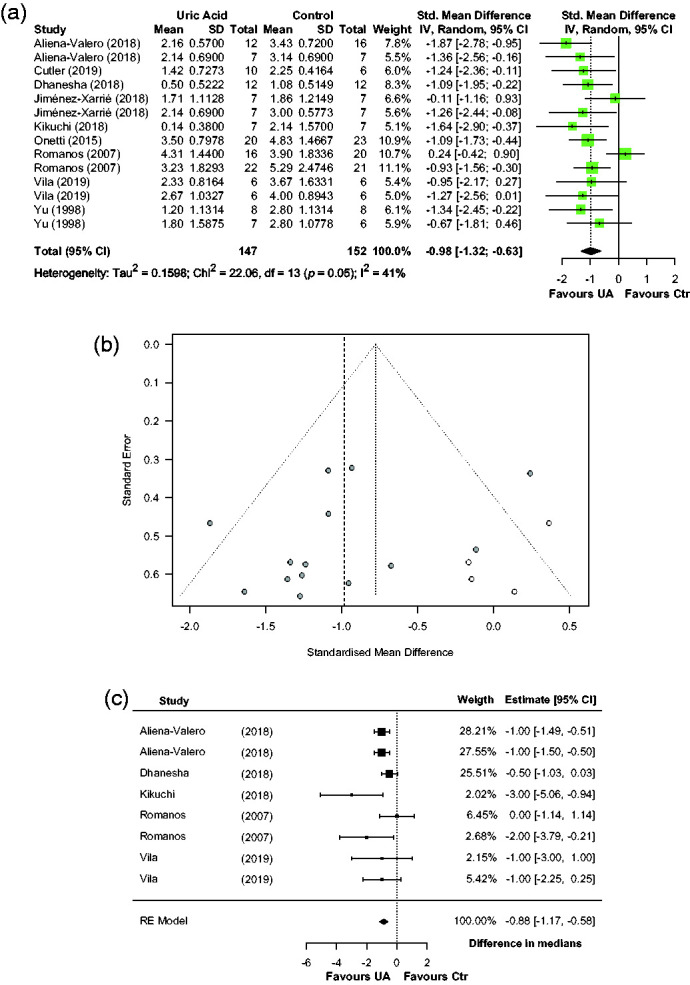
Figure 6.

Effect of UA on neurofunctional deficit: (a) forest plot and between-study heterogeneity; (b) funnel plot showing published studies (filled circles), trim-and-fill assigned studies (open circles), and the pooled estimate of efficacy before adjusting for publication bias (dashed vertical line) and (c) forest plot from sensitivity analysis using studies reporting medians for neurofunctional score.
