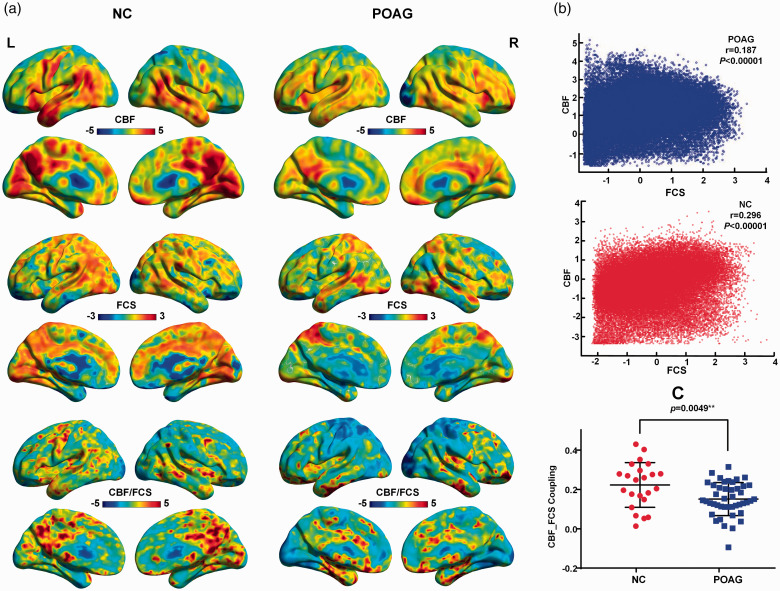
Figure 1.
Spatial distribution maps and reduced neurovascular coupling in patients with POAG. (a) Examples of the mapped spatial distributions of FCS, CBF and the CBF/FCS ratio in a patient with POAG and an NC. The two subjects exhibited similar spatial distributions in these measures. (b) Scatter plots demonstrating the spatial correlations across voxels between CBF and FCS in the same subjects (blue, patient; red, NC) represented in Figure 1(a). (c) Compared with NCs, POAG patients showed reduced CBF-FCS coupling within gray matter (P = 0.0049). FCS: functional connectivity strength; CBF: cerebral blood flow; POAG: primary open-angle glaucoma.

