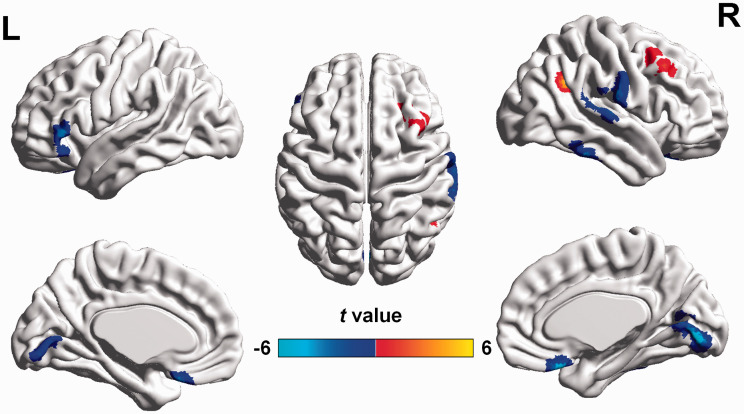
Figure 2.
Altered CBF/FCS ratios in POAG patients compared with NCs (GRF-corrected voxel P value < 0.001 and cluster P value <0.05). Compared with NCs, POAG patients exhibited decreased CBF/FCS ratios (cool colors) in the bilateral lingual gyri, bilateral rectal gyri, right superior and inferior temporal gyri, and left inferior frontal gyrus and increased CBF/FCS ratio (warm colors) in the right angular and right middle frontal gyri. FCS: functional connectivity strength; CBF: cerebral blood flow; POAG: primary open-angle glaucoma; GRF: Gaussian random field.

