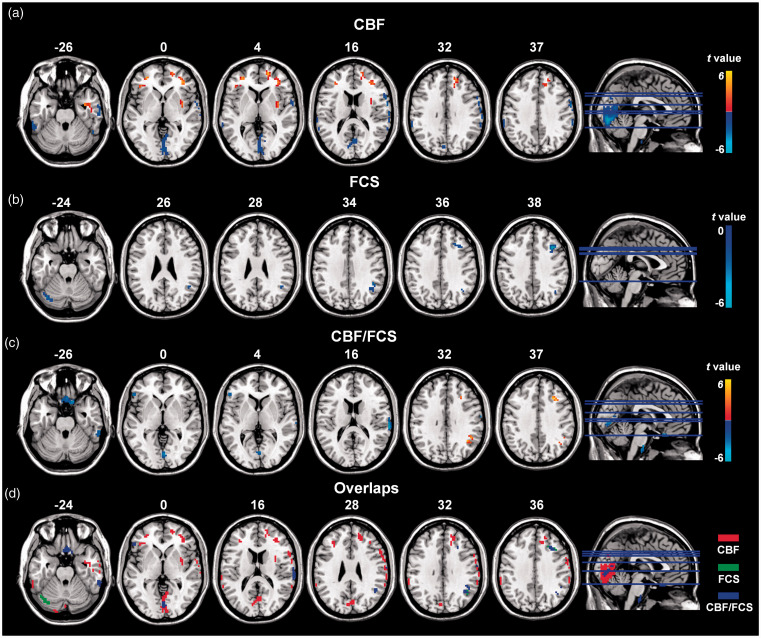
Figure 3.
Altered CBF, FCS, and CBF/FCS ratio in POAG patients compared with NCs (GRF-corrected voxel P value < 0.001 and cluster P value <0.05). (a) (b) and (c) show significantly increased (warm colors) and decreased (cool colors) CBF, FCS, and the CBF/FCS ratios, respectively, in patients with POAG. The regions in volume space (Figure 3(c)) are mapped into the surface space towards cortical vertex (Figure 2). (d) The overlay of clusters with significant differences between the two groups in CBF (red), FCS (green) and the CBF/FCS ratio (blue) indicated that the abnormal CBF/FCS ratios in POAG patients are predominantly driven by the CBF changes.

