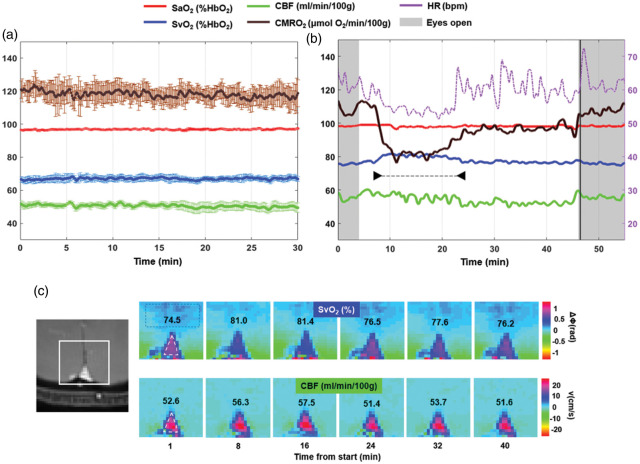
Figure 2.
Radial OxFlow (rOxFlow) during wakefulness and sleep. (a) Temporal stability of rOxFlow during wakefulness. The group means of the metabolic quantities extracted from a pool of five subjects are plotted as a function of time during 30 min of alert wakefulness (CMRO2: cerebral metabolic rate of O2; SaO2: arterial O2 saturation; SvO2: venous O2 saturation; CBF: total cerebral blood flow). Error bars represent standard errors. (b) Metabolic parameters measured in a subject (F, 36 years), self-reporting to be able to fall asleep (arrowheads). Note the large drop in CMRO2, rise in SvO2 along with drop in heart rate (HR). During the initial and final portions of the protocol, the subject was awake, with eyes open. Vertical black line indicates the awakening through vocal instructions. (c) Magnitude image showing the region encompassing the superior sagittal sinus (SSS, left). Colormaps of ΔΦSSS-ref, phase difference between SSS (triangle) and a reference region in the tissue (rectangle) and velocity maps plotted for different time points, in the subject of panel B. ΔΦSSS-ref is used to compute SvO2, expressed as %HbO2. CBF was obtained as the product of voxel velocity and SSS cross-sectional area and expressed in ml/min/100 g tissue. The respective SvO2 and CBF values are inserted in the image panels.

