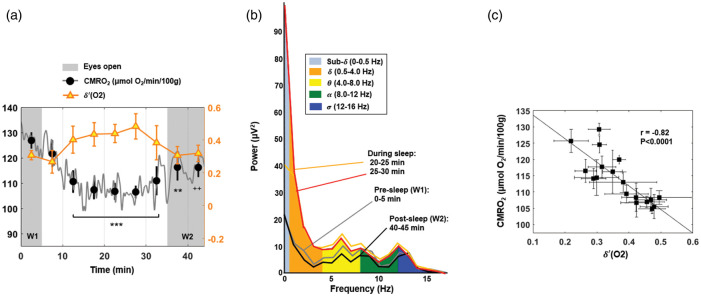
Figure 3.
CMRO2 and temporal evolution of -power. (a) Power spectral density ratio recorded by the O2 channel, superimposed on CMRO2 time-course for a subject with onset of sleep occurring in the central portion of the protocol (S01 M, 40 years). Shaded regions represent the periods of alert wakefulness (W1 and W2). Average values over 5-min time windows are depicted, together with the standard deviation (SD). For each 5-min interval, CMRO2 is compared with the pre-sleep average, reaching a maximum relative decrease of 16% in this subject (++P < 0.005; **P = 0.001; ***P < 0.0001). (b) EEG power bands recorded by the cortex electrode O2 during the EEG+rOxFlow protocol for the same subject. The data show increased low-frequency components (sub-, , ) between 20 and 30 min, and decreased -activity during W1 and W2 (0–5 min and 40–45 min, respectively). (c) Correlation between CMRO2 and -power ratio ((O2)), in the same subject. Markers represent average values over 2.5 min successive time windows, with error bars indicating SD.

